. 2005 Oct;7(10):930-43.
doi: 10.1593/neo.05379.

Gastrin exerts pleiotropic effects on human melanoma cell biology

Affiliations

Gastrin exerts pleiotropic effects on human melanoma cell biology

Véronique Mathieu et al. Neoplasia. 2005 Oct.

Abstract

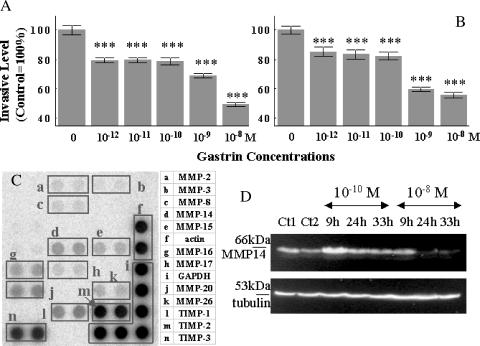
The effects of gastrin (G17) on the growth and migration factors of four human melanoma cell lines (HT-144, C32, G-361, and SKMEL-28) were investigated. The expression patterns of cholecystokinin (CCK)(A), CCK(B), and CCK(C) gastrin receptors were investigated in these cells and in seven clinical samples by means of reverse transcription polymerase chain reaction. Melanoma cells appear to express mRNA for CCK(C) receptors, but not for CCK(A) or CCK(B) receptors. Although gastrin does not significantly modify the growth characteristics of the cell lines under study, it significantly modifies their cell migration characteristics. These modifications occur at adhesion level by modifying the expression levels of alpha(v) and beta3 integrins, at motility level by modifying the organization of the actin cytoskeleton, and at invasion level by modifying the expression levels of matrix metalloproteinase 14. We recently demonstrated the presence of CCK(B) receptors in mouse endothelial cells involved in glioblastoma neoangiogenesis. Chronic in vivo administration of a selective CCK(B) receptor antagonist to mice bearing xenografts of human C32 melanoma cells significantly decreased levels of neoangiogenesis, resulting in considerable delays in the growth of these C32 xenografts. In conclusion, our study identifies the pleiotropic effects of gastrin on melanoma cell biology.


Figures

Figure 1
Figure 1
Illustration of the mRNA expression pattern of the CCKA, CCKB, and CCKC receptors in four human melanoma cell lines (lanes 4–7 in A, C, and E) and seven human melanoma metastases (lanes 8–14 in B, D, and F) assessed by means of RT-PCR. Lane 1: kilobase plus ladder; lane 2: negative control; lane 3: gallbladder tissue (positive control for the CCKA receptor); lane 4: HT-144 cell line; lane 5: G-361 cell line; lane 6: C32 cell line; lane 7: SKMEL-28 cell line. (A and B) The results obtained with primer p2, which we used for the CCKA receptor (cf. Table 1). (C and D) Those obtained with primer p6, which we used for the CCKB receptor (cf. Table 1). (E and F) Those obtained with primer p7, which we used for the CCKC receptor (cf. Table 1). An RT-PCR for β-actin was performed with all the extracts as quality control (G and H).
Figure 2
Figure 2
(A) Determination of the influence of gastrin on motility levels (quantified by means of computer-assisted phase-contrast microscopy) in the HT-144, G-361, C32, and SKMEL-28 human melanoma cells. The motility levels are related to the maximum relative distance from the point of origin (in µm/hr) traveled by each cell analyzed individually over an 8-hour period of observation. The control value was arbitrarily normalized to “0%.” (B) Human HT-144 melanoma cells were subjected to a cDNA microarray to determine the pattern of integrin-specific RNA expression. (C) Characterization of the influence of 10 nM gastrin (G17) on the levels of expression of αv (gray bars in C) and β3 (black bars in C) integrin subunits in HT-144 human melanoma cells 24 hours after the addition of gastrin to the melanoma cell culture medium. The levels of integrin subunit expression were determined by means of computer-assisted fluorescence microscopy. (D and E) The morphologic appearance of fibrillar (green fluorescence) as opposed to globular (red fluorescence) actin in the cytoskeletons of the untreated HT-144 cells (D) and those treated for 3 hours with 10 nM G17 (E). The ratio of fibrillar/globular actin was quantitatively determined by means of computer-assisted fluorescence microscopy (F). The data are presented as means (thick bars) ± standard error of the mean (thin bars). **P < .01 and ***P < .001 in comparison with the control.
Figure 3
Figure 3
Characterization of the influence of gastrin (from 10-12 to 10-8 M) on the invasiveness (in Boyden chambers coated with Matrigel) of HT-144 (A) and G-361 (B) human melanoma cells. (C) HT-144 human melanoma cells were subjected to a cDNA microarray to determine the pattern of MMP-specific RNA expression. (D) The gastrin-induced effects on the MMP-14 expression. Western blot analysis was performed 9, 24, and 33 hours after the addition of 0.1 and 10 nM gastrin (except in the control, Ct) to the culture medium of human HT-144 melanoma cells.
Figure 4
Figure 4
Therapeutic combination of gastrin and cytotoxic agents in scratch wound assay. Colonization of a mechanical wound in a subconfluent HT-144 cell population (cf. black rectangles in A) was followed over time (complete wound healing is shown in B). (C) The delay in the wound healing process obtained when HT-144 cells were submitted to gastrin treatment [10 nM; duration of the gastrin exposure varied from 0 hour (no gastrin treatment) to 24 hours on the x-axis] before the cytotoxic insult with cisplatin used at 0.1 µM (black squares) or 1 µM (black dots). Control took the shape of HT-144 cells cultured in the absence of gastrin and cisplatin and was arbitrarily normalized to 100% of wound colonization after 62 hours of culture. (D) Western blot analyses of the levels of expression of p53 and PTEN in human MCF-7 breast cancer (positive control) and human melanoma HT-144 and C32 melanoma cells either challenged with 10 µM adriamycin (ADR) or left unchallenged. Cell death processes were investigated by means of flow cytometry and Western blot analysis for PARP, as shown in (E). The open bars in the upper part represent normal cells (i.e., cells not in the process of dying), the black bars (located between the open and gray bars, and so thin that they are almost invisible) represent the proportion of apoptotic cells, and the gray bars represent the proportion of cells dying from nonapoptotic processes. The bottom part of (E) deals with the Western blot analysis. The experimental conditions on the x-axis are as follows: Ct = control; G17 = 10 nM gastrin for 24 hours; G17 6 hours + Cis = 10 nM gastrin added 6 hours before 10 µM cisplatin, with PARP cleavage determination carried out 48 hours after the addition of cisplatin to the culture medium of HT-144 cells; G17 24 hours + Cis = 10 nM gastrin 24 hours before 10 µM cisplatin, with PARP cleavage determination carried out 48 hours after the addition of cisplatin to the culture medium of the HT-144 cells. (F) Characterization over time of the effects of 10 nM gastrin on the levels of expression and activation (473Serphospho-Akt) of Akt and on the levels of expression of mTOR.
Figure 5
Figure 5
The effects of the L365,260 CCKB gastrin receptor antagonist on neoangiogenesis in C32 human melanoma cell xenografts (A). The black dots represent the tumor size of the control group, whereas the white squares represent the one in the group treated with the L365,260 product (10 mg/kg five times a week during an 8-week period). The L365,260-induced decrease in tumor growth can be related to a significant decrease in angiogenesis evidenced by the quantification of the vessels (illustrated in B; cf. black arrow) shown in the upper panel of (A) (Ct: control group; L365: treated group). The expression patterns of p53 and Ki-67 in C32 xenografts are illustrated in (C) (G x400) and (D) (G x200), respectively. The immunohistochemical stainings for HMB45 in C32 (E; G x400) and HT-144 (F; G x400) tumors as well as for S100B (G; G x200) (H; G x400) confirmed the melanoma origin and the melanoma biologic features of these xenografted models.

References

    1. Lawson DH. Update on the systemic treatment of malignant melanoma. Semin Oncol. 2004;31:33–37. - PubMed
    1. Kim KB, Eton O, East MJ, Hodges C, Papadopoulos NE, Grimm EA,, Bedikian AY. Pilot study of high-dose, concurrent biochemotherapy for advanced melanoma. Cancer. 2004;101:596–603. - PubMed
    1. Pollak MN, Schernhammer ES, Hankinson SE. Insulin-like growth factors and neoplasia. Nat Rev Cancer. 2004;4:505–518. - PubMed
    1. Satyamoorthy K, Li G, Vaidya B, Patel D, Herlyn M. Insulin-like growth factor-1 induces survival and growth of biologically early melanoma cells through both the mitogen-activated protein kinase and β-catenin pathways. Cancer Res. 2001;61:7318–7324. - PubMed
    1. Satyamoorthy K, Li G, Vaidya B, Kalabis J, Herlyn M. Insulin-like growth factor-1-induced migration of melanoma cells is mediated by interleukin-8 induction. Cell Growth Differ. 2002;13:87–93. - PubMed

Publication types

MeSH terms

LinkOut - more resources