. 2006 Aug;18(8):1190-200.
doi: 10.1016/j.cellsig.2005.09.007. Epub 2005 Oct 19.

G protein betagamma11 complex translocation is induced by Gi, Gq and Gs coupling receptors and is regulated by the alpha subunit type

Affiliations

G protein betagamma11 complex translocation is induced by Gi, Gq and Gs coupling receptors and is regulated by the alpha subunit type

Inaki Azpiazu et al. Cell Signal. 2006 Aug.

Abstract

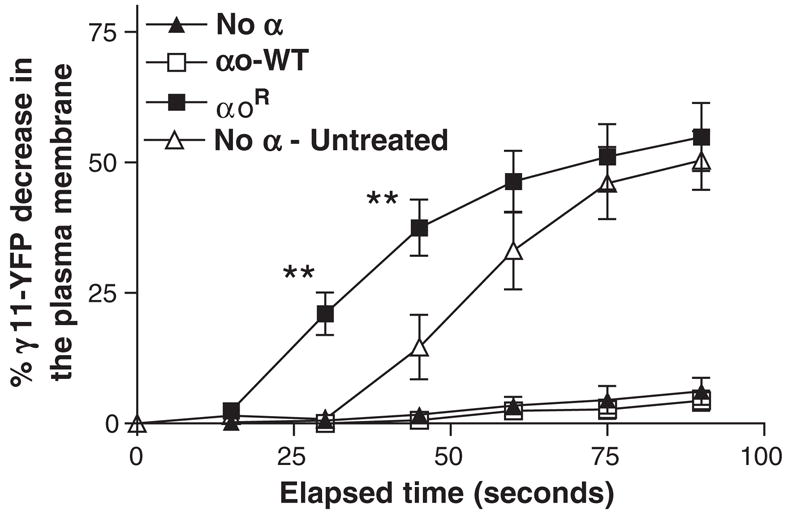
G protein activation by Gi/Go coupling M2 muscarinic receptors, Gq coupling M3 receptors and Gs coupling beta2 adrenergic receptors causes rapid reversible translocation of the G protein gamma11 subunit from the plasma membrane to the Golgi complex. Co-translocation of the beta1 subunit suggests that gamma11 translocates as a betagamma complex. Pertussis toxin ADP ribosylation of the alphai subunit type or substitution of the C terminal domain of alphao with the corresponding region of alphas inhibits gamma11 translocation demonstrating that alpha subunit interaction with a receptor and its activation are requirements for the translocation. The rate of gamma11 translocation is sensitive to the rate of activation of the G protein alpha subunit. alpha subunit types that show high receptor activated rates of guanine nucleotide exchange in vitro support high rates of gamma11 translocation compared to alpha subunit types that have a relatively lower rate of guanine nucleotide exchange. The results suggest that the receptor induced translocation of gamma11 is controlled by the rate of cycling of the G protein through active and inactive forms. They also demonstrate that imaging of gamma11 translocation can be used as a non-invasive tool to measure the relative activities of wild type or mutant receptor and alpha subunit types in a live cell.


Figures

Fig. 1
Fig. 1
M2 receptor activation of Go induces γ11-YFP translocation. (A) Gray scale fluorescence emission images of M2-CHO cells expressing αo-WT, β1 and γ11-YFP which were imaged as described in the Methods section. Images shown correspond from top to bottom with frames 5, 11 and 21 of a representative experiment. Frame 5 corresponds to an image before agonist addition, frame 11 to an image in the presence of agonist and frame 21 in the presence of antagonist following agonist addition. Arrows in images highlight regions on the plasma membrane and the Golgi emitting the YFP signal that show distinct changes after receptor activation or inactivation. (B) Average YFP emission intensity from selected plasma membrane and Golgi regions of single cell images at various time points were determined and plotted. Images were captured every 20 s and the time points at which agonist (100 μM carbachol) or antagonist (1 mM atropine) were introduced are indicated by the arrows. Agonist is denoted Ag and antagonist as Ant. The delay in stimulation is caused by dead volume in the fluid delivery system which was determined to be ~15–30 s using a fluorescent rhodamine tracer. Average gray scale intensities of YFP emission were calculated using MetaMorph. Details are described in the Methods section. Representative of at least four experiments.
Fig. 2
Fig. 2
M2 induced αi1 activation leads to γ11-YFP translocation. (A) Images and (B) plots of average YFP emission intensity values from selected plasma membrane and Golgi regions of single cell images. M2-CHO cells expressed αi1R, β1 and γ11-YFP. Transfected cells were treated with 200 μg PTX/ml for 3–5 h to block endogenous G protein αi and imaged as described in Methods and Fig. 1 legend. Arrows in images highlight regions on the plasma membrane and the Golgi emitting the YFP signal that show distinct changes after receptor activation or inactivation. Images were captured every 15 s and the time points at which agonist (1 mM acetylcholine) and antagonist (100 μM atropine) were introduced are indicated by arrows. Representative of at least four experiments.
Fig. 3
Fig. 3
M3 induced αq activation leads to γ11-YFP translocation. (A) Images and (B) plots of average YFP intensity values from selected plasma membrane and Golgi regions of single cell images. M3-CHO cells expressing αq, β1 and γ11-YFP. Transfected cells were treated with PTX and imaged as described in Fig. 2 legend and the Methods section. Arrows in images highlight the regions on the plasma membrane and the Golgi emitting the YFP signal that show distinct changes after receptor activation or inactivation. After antagonist treatment the cell has undergone a change in shape which occurs occasionally with these cells during the course of an experiment. On the plots, the time of introduction of agonist (1 mM acetylcholine) and antagonist (100 μM atropine) are indicated by arrows. Representative of at least four experiments.
Fig. 4
Fig. 4
β2AR induced αs activation leads to γ11-YFP translocation. (A) Images and (B) plots of average YFP intensity values from selected plasma membrane and Golgi regions of single cell images. β2AR-CHO cells expressing αs, β1 and γ11-YFP. Transfected cells were treated with PTX and imaged as described earlier. Arrows in images highlight regions on the plasma membrane and the Golgi emitting the YFP signal that show distinct changes after receptor activation or inactivation. On the plots, the time of introduction of agonist (1 μM isoproterenol) and antagonist (100 μM alprenolol) are indicated by arrows. Representative of at least four experiments.
Fig. 5
Fig. 5
M2 induced αi1 activation leads to γ11-CFP and β1-YFP translocation. Plots of average CFP (A and B) and YFP (C and D) intensity values from selected plasma membrane (A and C) and Golgi regions (B and D) of single cell images. M2-CHO cells expressed αi1R, β1-YFP and γ11-CFP. Transfected cells were treated with PTX and imaged as described in Methods and previous legends. CFP and YFP images were captured every 15 s and the time points at which agonist (1 mM acetylcholine) and antagonist (100 μM atropine) were introduced are indicated by arrows. Representative of two experiments.
Fig. 6
Fig. 6
M3 induced αq activation leads to γ11-CFP and β1-YFP translocation. Plots of average CFP (A and B) and YFP (C and D) intensity values from selected plasma membrane (A and C) and Golgi regions (B and D) of single cell images. M2-CHO cells expressed αq, β1-YFP and γ11-CFP. Transfected cells were treated with PTX and imaged as described in Methods and previous legends. CFP and YFP images were captured every 15 s and the time points at which agonist (1 mM acetylcholine) and antagonist (100 μM atropine) were introduced are indicated by arrows. Representative of two experiments.
Fig. 7
Fig. 7
Colocalization of γ11 and a Golgi marker. (A) Images of M3-CHO cells expressing αq, β1, γ11-CFP, galT-YFP (a trans-Golgi marker) and treated with PTX were captured before the introduction of acetylcholine, after the introduction of acetylcholine and after subsequent inactivation with the antagonist, atropine. (B) Images of β2AR-CHO cells expressing αs, β1, γ11-CFP, galT-YFP and treated with PTX were captured before the introduction of isoproterenol, after the introduction of isoproterenol and after subsequent inactivation with the antagonist alprenolol. Images generated as in A. Representative of at least three experiments. Colourized versions of the same figures are in Supplementary material Fig. 2.
Fig. 8
Fig. 8
Activation of the G protein α subunit is an absolute requirement for translocation of γ11-YFP. M2-CHO cells coexpressing β1 and γ11-YFP without introduced α subunit (No α), with αo wild type (αo-WT) or PTX resistant αo mutant (αoR) were observed after PTX treatment as described above. Cells without an introduced α subunit were also observed in the absence of PTX treatment as a control (No α — untreated). Agonist introduction was initiated after image acquisition at time zero. The plasma membrane region was selected in the single cell images and the average YFP emission intensity determined using MetaMorph. Percentage decrease in γ11-YFP in the plasma membrane was determined by comparing images before and after agonist addition. Details of image processing and computation of percent decrease in YFP emission intensity on the plasma membrane are in the Methods section. Data in plots correspond to means±SEM of at least four experiments. Differences are significant at time points indicated, **p<0.005.
Fig. 9
Fig. 9
Effective interaction of the α subunit with a receptor is essential for γ11-YFP translocation. (A) M2-CHO cells coexpressing β1, γ11-YFP without introduced α subunit (No α), with CFP tagged PTX resistant αo (αoR-CFP) or PTX resistant αo-s chimera (αo-sR-CFP) were treated with PTX and imaged as above. The percentage of γ11-YFP decrease in the plasma membrane was calculated as described earlier. Data in plots correspond to averages±SEM of at least four experiments. Differences between αoR-CFP and αo-sR-CFP are significant at time points indicated (*p<0.05, **p<0.005). (B) M2-CHO cells coexpressing β1, γ11-YFP and αoR-CFP or αo-sR-CFP were photobleached for 2 min with illumination selective for YFP in the absence of a neutral density filter. Recovery of CFP emission intensity was compared before and after the bleaching treatment [12]. Cells were maintained in HBSS. Mean±SEM of results from 14 cells.
Fig. 10
Fig. 10
G protein αo and αi subtypes have different abilities to promote γ11-YFP translocation. (A) M2-CHO cells coexpressing β1, γ11-YFP and one of the PTX resistant α subunit types, αoR, αi1R or αi2R subunits were treated with PTX as described earlier. The same cells without any introduced α subunit were imaged as control (No α) after treatment with PTX. Agonist introduction was initiated after the image acquisition at time zero. Significant differences between the translocation responses of cells expressing αoR and αi1R are denoted by asterisks at time points on the plot specific to αo expressing cells. Similarly, asterisks at time points on the plot specific to αi1 expressing cells indicate significant difference in translocation responses between αi1 and αi2 expressing cells. (B) M2-CHO cells coexpressing β1, γ11-YFP and CFP-tagged αoR (αoR-CFP) or αi1R (αi1R-CFP) were PTX treated and observed after agonist introduction as described before. The images were processed and the YFP emission decrease was computed as described in Methods. Cells that had similar CFP emission intensities from both αoR-CFP and αi1R-CFP expressing cells were analyzed to ensure that expression of the two different α subtypes were the same. Significant differences in percent YFP decrease between cells expressing αoR-CFP and αi1R-CFP are indicated at time points. Details of image processing and computation of percent decrease in YFP emission intensity on the plasma membrane are in the Methods section. Data in plots correspond to averages and SEM of at least four experiments (*p<0.05, **p<0.005).

Similar articles

Cited by

References

    1. Akgoz M, Kalyanaraman V, Gautam N. J Biol Chem. 2004;279(49):51541. - PubMed
    1. Dell'Acqua ML, Carroll RC, Peralta EG. J Biol Chem. 1993;268(8):5676. - PubMed
    1. Hunt TW, Carroll RC, Peralta EG. J Biol Chem. 1994;269(47):29565. - PubMed
    1. Neves SR, Ram PT, Iyengar R. Science. 2002;296(5573):1636. - PubMed
    1. Wong SK. Neurosignals. 2003;12(1):1. - PubMed

Publication types

MeSH terms

Substances

LinkOut - more resources