. 2005 Oct 20;33(18):5829-37.
doi: 10.1093/nar/gki895. Print 2005.

Application of single molecule technology to rapidly map long DNA and study the conformation of stretched DNA

Affiliations

Application of single molecule technology to rapidly map long DNA and study the conformation of stretched DNA

Kevin M Phillips et al. Nucleic Acids Res. .

Abstract

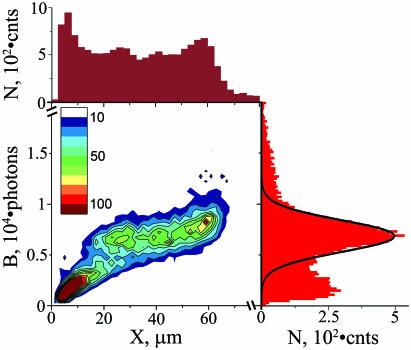
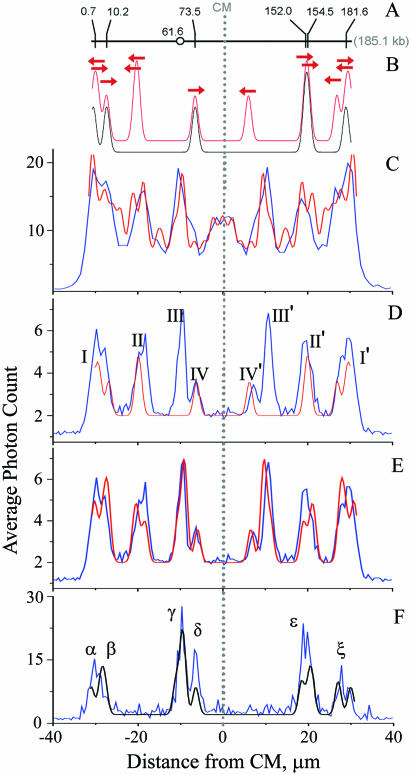
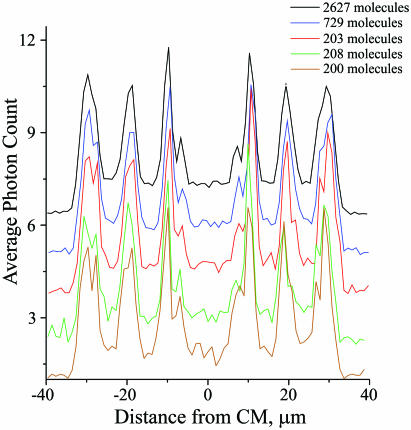
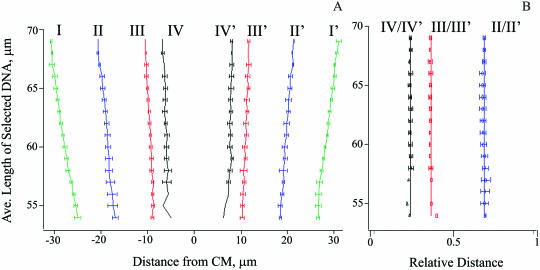
Herein we describe the first application of direct linear analysis (DLA) to the mapping of a bacterial artificial chromosome (BAC), specifically the 185.1 kb-long BAC 12M9. DLA is a single molecule mapping technology, based on microfluidic elongation and interrogation of individual DNA molecules, sequence-specifically tagged with bisPNAs. A DNA map with S/N ratio sufficiently high to detect all major binding sites was obtained using only 200 molecule traces. A new method was developed to extract an oriented map from an averaged map that included a mixture of head-first and tail-first DNA traces. In addition, we applied DLA to study the conformation and tagging of highly stretched DNA. Optimal conditions for promoting sequence-specific binding of bisPNA to an 8 bp target site were elucidated using DLA, which proved superior to electromobility shift assays. DLA was highly reproducible with a hybridized tag position localized with an accuracy of +/-0.7 microm or +/-2.1 kb demonstrating its utility for rapid mapping of large DNA at the single molecule level. Within this accuracy, DNA molecules, stretched to at least 85% of their contour length, were stretched uniformly, so that the map expressed in relative coordinates, was the same regardless of the molecule extension.


Figures

Figure 1
Figure 1
Characterization of DNA stretching. A two-dimensional histogram of burst size (B is the total number of photons per molecule) and length (X is the DNA extension in the direction of flow) for individual DNA molecules is shown as a heat map: 500 photons by 2 µm binning, respectively, and histogram occupancy as indicated in the inset legend. The adjacent histograms show distributions of DNA lengths (maroon at the top) and burst sizes (red at the right) with an interpolated Gaussian curve (black line) corresponding to full size BAC DNA. N is number of events. Data include 15 283 molecules.
Figure 2
Figure 2
Comparison of theoretical and experimental maps. (A) Positions of 6 GAG AAG AA target sites on BAC 12M9. Circle indicates position of the site responsible for peak III. (B) Theoretical maps for equal mixture of unoriented molecules (red) and for head-first, oriented molecules (black). Sites represented by 5 kb-wide Gaussian. Arrows, one for every target site, show peak positions for head-first or reverse orientations. (C) Unoriented map (blue) observed under low specificity conditions. (D and E) The same unoriented map (blue) observed under high stringency conditions. (F) Oriented map (blue) obtained by selecting head-first DNA molecules having tags at sites IV and/or II′. Each experimental map shows average intensity of the bound fluorescent tags as a function of distance from CM, at 0.5 µm steps. Maps include molecules 62–65 µm long, aligned at their CMs, which are denoted as the zero coordinate. Maps C, D, and F include 1035, 1993 and 87 molecules, respectively. Theoretical oriented (black) and unoriented (red) maps include only target sites (D), plus extended P-loops (E and F), plus SEMM sites (C). See text for details.
Figure 3
Figure 3
Unoriented maps obtained with different numbers of molecules. Upper black map includes 2627 DNA molecules with sizes of 62–66 µm. Blue map includes a subset of 729 DNA molecules within narrower size interval of 63.5–64.5 µm. Three lower maps red, green and brown are obtained with different subsets of the narrow size selection (63.5–64.5 µm), which include 203, 208 and 200 DNA molecules, respectively. Maps were obtained with 1 µm step and displaced along the ordinate to simplify comparison. See Figure 2 legend for other details.
Figure 4
Figure 4
Analysis of DNA conformation under different degrees of stretching. (A) Measured positions of major peaks in unoriented maps. Roman numbers defined in Figure 2D. (B) Relative distances between peaks calculated as the ratio of distances between symmetric peaks and the outermost peaks LI–I′. Symbols II/II′, III/III′ and IV/IV′ denote the relative distances LII–II′/LI–I′, LIII–III′/LI–I′ and LIV–IV′/LI-I′, respectively. Traces of DNA molecules at 5 µm intervals were averaged, with the ordinate centered on the selection interval. Lines in panel A are drawn by eye; straight vertical lines in panel B are drawn at the positions corresponding to the averages of II/II′, III/III′ and IV/IV′ datasets at 0.68, 0.36 and 0.24, respectively.

References

    1. Norwood D.A., Sands J.A. Physical map of the Clostridium difficile chromosome. Gene. 1997;201:159–168. - PubMed
    1. Ding C., Cantor C.R. Direct molecular haplotyping of long-range genomic DNA with M1-PCR. Proc. Natl Acad. Sci. USA. 2003;100:7449–7453. - PMC - PubMed
    1. Mitra R.D., Butty V.L., Shendure J., Williams B.R., Housman D.E., Church G.M. Digital genotyping and haplotyping with polymerase colonies. Proc. Natl Acad. Sci. USA. 2003;100:5926–5931. - PMC - PubMed
    1. Gabriel S.B., Schaffner S.F., Nguyen H., Moore J.M., Roy J., Blumenstiel B., Higgins J., DeFelice M., Lochner A., Faggart M., et al. The structure of haplotype blocks in the human genome. Science. 2002;296:2225–2229. - PubMed
    1. Weiss K.M., Clark A.G. Linkage disequilibrium and the mapping of complex human traits. Trends Genet. 2002;18:19–24. - PubMed

Publication types