. 2005 Nov 1;102(44):15942-7.
doi: 10.1073/pnas.0507611102. Epub 2005 Oct 21.

Support from the relationship of genetic and geographic distance in human populations for a serial founder effect originating in Africa

Affiliations

Support from the relationship of genetic and geographic distance in human populations for a serial founder effect originating in Africa

Sohini Ramachandran et al. Proc Natl Acad Sci U S A. .

Abstract

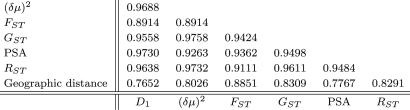
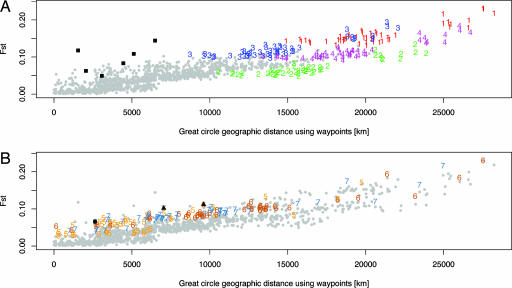
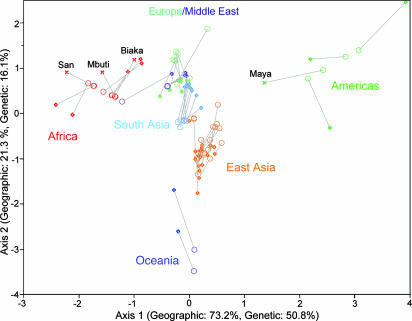
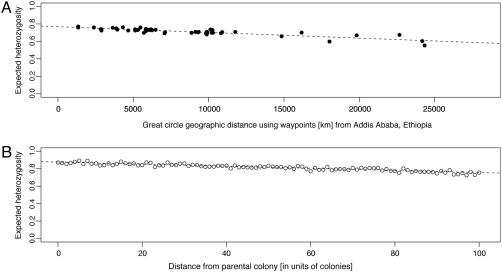
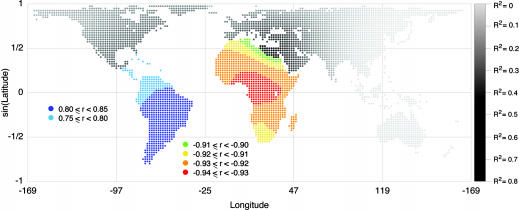
Equilibrium models of isolation by distance predict an increase in genetic differentiation with geographic distance. Here we find a linear relationship between genetic and geographic distance in a worldwide sample of human populations, with major deviations from the fitted line explicable by admixture or extreme isolation. A close relationship is shown to exist between the correlation of geographic distance and genetic differentiation (as measured by F(ST)) and the geographic pattern of heterozygosity across populations. Considering a worldwide set of geographic locations as possible sources of the human expansion, we find that heterozygosities in the globally distributed populations of the data set are best explained by an expansion originating in Africa and that no geographic origin outside of Africa accounts as well for the observed patterns of genetic diversity. Although the relationship between F(ST) and geographic distance has been interpreted in the past as the result of an equilibrium model of drift and dispersal, simulation shows that the geographic pattern of heterozygosities in this data set is consistent with a model of a serial founder effect starting at a single origin. Given this serial-founder scenario, the relationship between genetic and geographic distance allows us to derive bounds for the effects of drift and natural selection on human genetic variation.


Figures

Fig. 1.
Fig. 1.
Scatterplot of FST and geographic distance. Red dots denote within-region comparisons, green triangles indicate comparisons between populations in Africa and Eurasia, and blue diamonds represent comparisons with America and Oceania. (A) The relationship between FST and geographic distance computed using great circle distances. R2 for the linear regression of genetic distance on geographic distance is 0.5882. (B) The correction for large bodies of water produces a different scatterplot (R2 = 0.7835). The regression line fitted to the data [formula image = 4.35 × 10⁻³ + (6.28 × 10⁻⁶) × (geographic distance in kilometers)] is drawn in black.
Fig. 2.
Fig. 2.
Populations influencing the linear regression. The two plots are identical except that different features are highlighted in A and B. The number representing each population is the rank of its influence on the regression, with 1 indicating the population whose removal from the data alters the regression by the greatest amount (see Materials and Methods and Table 2). All other points not involving comparisons with the populations of greatest influence are in gray. (A) Red 1 denotes comparisons including Karitiana; green 2, Maya; navy blue 3, Pima; and purple 4, Colombia. Black squares show comparisons between the American populations. Comparisons involving the Maya (labeled as 2) tend to produce smaller FST values than are predicted by the regression line, and excluding the Maya from analysis increases R2 to 0.8183. The slight increase in the error sum of squares of the regression when the Maya are included in the data set shows that they have little influence on the observed pattern. (B) Orange 5 denotes comparisons including Kalash; brown 6, San; and blue 7, Mbuti Pygmy. The black circle is the comparison between the San and Mbuti Pygmies. The black triangles are comparisons of the Kalash to the San and Mbuti. The Kalash have been identified as a genetic isolate (11) from the rest of Pakistan; here, comparisons of the Kalash with other Central/South Asian and East Asian populations produce large residuals, whereas comparisons with European and Middle Eastern groups do not, consistent with the closer relationships of the Kalash to groups in these regions than to groups in East Asia or to other groups in Pakistan (11, 27). The high FST values observed in comparisons with the Mbuti Pygmies or the San, both hunter-gatherer populations, are likely to be a consequence of the deep genetic structure believed to exist in Africa and of the amount of genetic isolation these groups have experienced from other African populations (8, 28).
Fig. 3.
Fig. 3.
Standardized principal coordinates of both the geographic and genetic distance matrices of all pairwise comparisons, superimposed on a common set of axes. Scale on axes indicates SDs from the mean of each respective coordinate. Each population is represented by two points joined by a line: its geographic standardized principal coordinate score is shown by an open circle, and its genetic standardized principal coordinate score is marked by an open diamond (except in the case of the labeled populations, which are indicated by crosses). Regions of the world and certain populations of interest are labeled. The first three principal coordinates from the genetic distance matrix explain 50.8%, 16.1%, and 8.1% of the variation of genetic distance across populations, respectively, and the first three principal coordinates of the geographic distance matrix explain 73.2%, 21.3%, and 2.7% of the variation of geographic distance across populations.
Fig. 4.
Fig. 4.
The decay of heterozygosity plotted against geographic distance between populations and a possible origin of expansion. (A) Heterozygosity in the HGDP-CEPH populations against distance from Addis Ababa, Ethiopia (9N, 38E). Distances were corrected for large bodies of water. The equation of the regression line is heterozygosity = 0.7682 - (6.52 × 10⁻⁶) × (distance from Addis Ababa). R2 = 0.7630. (B) Simulation results of the decay of heterozygosity with distance using a model of a serial founder effect. The simulation is based exclusively on mutation at a realistic rate and drift, as described in more detail in Supporting Text. The parameter values generating the simulation were chosen so as to fit the observed ΔH of A. The number of bottlenecks is n = 100, and the number of founders per bottleneck, Nb, is 250, which approximates the effective population size of a population of hunter-gatherers (35, 36). Other pairs of values of n and Nb in the same ratio would fit the data equally well, because their ratio is the main quantity affecting the slope. The equation of the fitted line is heterozygosity = 0.8761 - 0.0012 × (distance from the parental colony). R2 = 0.8587.
Fig. 5.
Fig. 5.
The origin of the human expansion. The color or shade of each of the 4,210 locations (shown as dots) indicates either a correlation coefficient r or an R2 value for the regression of expected heterozygosities in 53 HGDP-CEPH populations on geographic distance (corrected for large bodies of water) to the location displayed. Note that, for a simple linear regression, r2 = R2. Grayscale points indicate R2 values, as shown by the gradient on the right, and correlation coefficients r are displayed in Africa and South America to reflect the sign of the relationship between heterozygosity and geographic distance to locations in these continents. R2 values range from 0.757 to 0.870 in Africa and from 0.519 to 0.659 in South America. The maximum value of r (≈0.812) is observed when the origin is (30S, 50.2W); the minimum value of r (approximately -0.933) is observed when the origin is (4.3N, 12.8E).

References

    1. Malécot, G. (1991) The Mathematics of Heredity (Freeman, San Francisco).
    1. Kimura, M. & Weiss, G. H. (1964) Genetics 49, 561-576. - PMC - PubMed
    1. Cavalli-Sforza, L. L., Barrai, I. & Edwards, A. W. F. (1964) Cold Spring Harbor Symp. Quant. Biol. 29, 9-20. - PubMed
    1. Wijsman, E. M. & Cavalli-Sforza, L. L. (1984) Annu. Rev. Ecol. Syst. 15, 279-301.
    1. Morton, N. E. (1973) in Genetic Structure of Populations, ed. Morton, N. E. (Univ. Press of Hawaii, Honolulu), pp. 76-79.

Publication types