. 2005 Aug;52(8):1320-9.
doi: 10.1109/tuffc.2005.1509790.

A new imaging strategy using wideband transient response of ultrasound contrast agents

Affiliations

A new imaging strategy using wideband transient response of ultrasound contrast agents

Dustin E Kruse et al. IEEE Trans Ultrason Ferroelectr Freq Control. 2005 Aug.

Abstract

High-resolution clinical systems operating near 15 MHz are becoming more available; however, they lack sensitive harmonic imaging modes for ultrasound contrast agent (UCA) detection, primarily due to limited bandwidth. When an UCA is driven to nonlinear oscillation, a very wideband acoustic transient response is produced that extends beyond 15 MHz. We propose a novel strategy using two separate transducers at widely separated frequencies and arranged confocally to simultaneously excite and receive acoustic transients from UCAs. Experiments were performed to demonstrate that this new mode shows similar resolution, higher echo amplitudes, and greatly reduced attenuation compared to transmission at a higher frequency, and superior resolution compared to transmission and reception at a lower frequency. The proposed method is shown to resolve two 200 microm tubes with centers separated by 400 microm. Strong acoustic transients were detected for rarefaction-first 1-cycle pulses with peak-negative pressures above 300 kPa. The results of this work may lead to uses in flow and/or targeted imaging in applications requiring very high sensitivity to contrast agents.


Figures
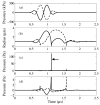
Fig. 1
Fig. 1
Simulated response of a 2-μm diameter microbubble in water to 2.25 MHz inverted (solid) and noninverted (dashed) pulses, shown in (a), using a modified Rayleigh-Plesset equation of motion [16]. The radius time curve for both pulses is shown in (b), and the emitted pressure is shown in (c) and (d), where (d) clips the amplitude to better show the weaker low-frequency components. Note the pressure spike or acoustic transient (denoted by the arrow) corresponding to the inverted driving pulse shown in (c), and its correspondence to maximum compression in (b).
Fig. 2
Fig. 2
Top: plot of received 10 cycle pulse (dotted, scaled down by 30 dB) and following application of a bandpass filter from 10 to 45 MHz (solid). The y-axis is voltage in millivolts at the output of the transducer for the filtered echo. Bottom: time-frequency power spectrum of nonfiltered echo showing 30 dB of dynamic range. Vertical scale is in megahertz and horizontal scale is time in microseconds.
Fig. 3
Fig. 3
Optical image under 20× magnification of two 200 μm cellulose tubes spaced apart by 400 μm, center-to-center. Scale bar at lower left is 200 μm wide.
Fig. 4
Fig. 4
Received power spectra (R15) from contrast agent echoes averaged over 128 pulses from the single tube for T2 PNPs of 100, 140, 200, 370, 520, and 730 kPa (solid) and for T15 PNPs of 300, 540, 940, and 1330 kPa (dashed). Vertical scale is in units of decibels referenced to 1 mW.
Fig. 5
Fig. 5
Spectral power at 15 MHz averaged over 128 pulses from the single tube for T2R15 (solid) and T15R15 (dashed). Vertical scale is in units of decibels referenced to 1 mW. Error bars are ± one standard deviation.
Fig. 6
Fig. 6
Measured −6 dB single tube diameter in microns as a function of PNP for T2R15 (solid) and T15R15 (dashed). Each point was averaged over 128 pulses.
Fig. 7
Fig. 7
(a) T2R2 (PNP = 370 kPa) power Doppler M-mode image of two tubes separated by 400 μm. (b) Mean power for T2R15 averaged over 512 pulses. The mean flow velocity in each tube was 2 cm/s and the PRF was 10 Hz for both cases. Color scale shows a 50 dB dynamic range.
Fig. 8
Fig. 8
(a) T2R15 (PNP = 370 kPa) power Doppler M-mode image of two tubes separated by 400 μm. (b) Mean power for T2R15 averaged over 512 pulses. (c) T15R15 (PNP = 300 kPa) power Doppler M-mode using the same receive transducer and orientation used for T2R15. (d) Corresponding mean power averaged over the duration of the M-mode. The mean flow velocity in each tube was 2 cm/s, and the PRF was 10 Hz for both cases. The T2R15 echoes were highpass filtered with cutoff at 10 MHz prior to envelope detection. Color scales show a 50 dB dynamic range.
Fig. 9
Fig. 9
Same as Fig. 8 except that one-way attenuation was applied to T2R15 (a) and (b) and two-way attenuation was applied to T15R15 (c) and (d). The attenuation was assumed to be constant across both vessels with a value of 0.5 dB/cm/MHz.
None
Dustin E. Kruse (S’99-M’04) received a B.A. degree in physics from the State University of New York College at Geneseo in 1996, the M.E. degree in electrical engineering from the University of Virginia in 1999, and the Ph.D. degree in biomedical engineering in 2004, also from the University of Virginia. His graduate work involved the development and application of high frequency ultrasound to image blood flow in the microcirculation. He is currently a research engineer at the University of California, Davis, Department of Biomedical Engineering, where his research interests are in the areas of velocity estimation, high frequency ultrasound, contrast-assisted imaging, and therapeutic ultrasound. He is a member of Sigma Pi Sigma.
None
Katherine Whittaker Ferrara (S’82–M’82–S’87–M’89–SM’99) Following the B.S. and M.S. degrees in electrical engineering, Dr. Ferrara worked for Sound Imaging, Inc. Folsom, CA and for General Electric Medical Systems, Rancho Cordova, CA in the areas of magnetic resonance and ultrasound imaging, during 1983–1988. She received her Ph.D. in electrical engineering and computer science in 1989 from the University of California, Davis. From 1989–1993 she was an Associate Professor in the Dept. of Electrical Engineering at California State University, Sacramento. From 1993–1995, she was a principal member of the research staff at the Riverside Research Institute, New York, NY, and an Adjunct Associate Professor at Cornell University Medical School, and from 1995–1998 she was an Associate Professor in the Department of Biomedical Engineering at the University of Virginia, Charlottesville. Since December of 1998, Dr. Ferrara has been Professor and Chair of Biomedical Engineering in the newly created Department of Biomedical Engineering at the University of California, Davis. Dr. Ferrara is an Associate Editor of the IEEE Transactions on Ultrasonics, Ferroelectrics and Frequency Control. She chaired the technical program for the 1997 IEEE Ultrasonics Symposium. She is a member of Tau Beta Pi and Sigma Xi and a fellow of the Acoustical Society of America. Her research interests are medical imaging and biomedical signal processing and particularly in the areas of ultrasonics and acoustics.

References

    1. Frinking PJ, Bouakaz A, Kirkhorn J, Ten Cate FJ, de Jong N. “Ultrasound contrast imaging: Current and new potential methods,”. Ultrasound Med Biol. 2000;26:965–975. - PubMed
    1. de Jong N, Bouakaz A, Frinking P. “Basic acoustic properties of microbubbles,”. Echocardiography. 2002;19:229–240. - PubMed
    1. Stride E, Saffari N. “Microbubble ultrasound contrast agents: A review,”. Proc Inst Mech Eng [H] 2003;217:429–447. - PubMed
    1. Morgan K, Averkiou M, Ferrara K. “The effect of the phase of transmission on contrast agent echoes,”. IEEE Trans Ultrason, Ferroelect, Freq Contr. 1998;45:872–875. - PubMed
    1. Simpson DH, Chin CT, Burns PN. “Pulse inversion Doppler: A new method for detecting nonlinear echoes from microbubble contrast agents,”. J Acoust Soc Amer. 1999;46:372–382. - PubMed

Publication types