. 2006 Jan;20(1):106-8.
doi: 10.1096/fj.05-4551fje. Epub 2005 Oct 24.

Effects of epigenetic modulation on reporter gene expression: implications for stem cell imaging

Affiliations

Effects of epigenetic modulation on reporter gene expression: implications for stem cell imaging

Manickam Krishnan et al. FASEB J. 2006 Jan.

Abstract

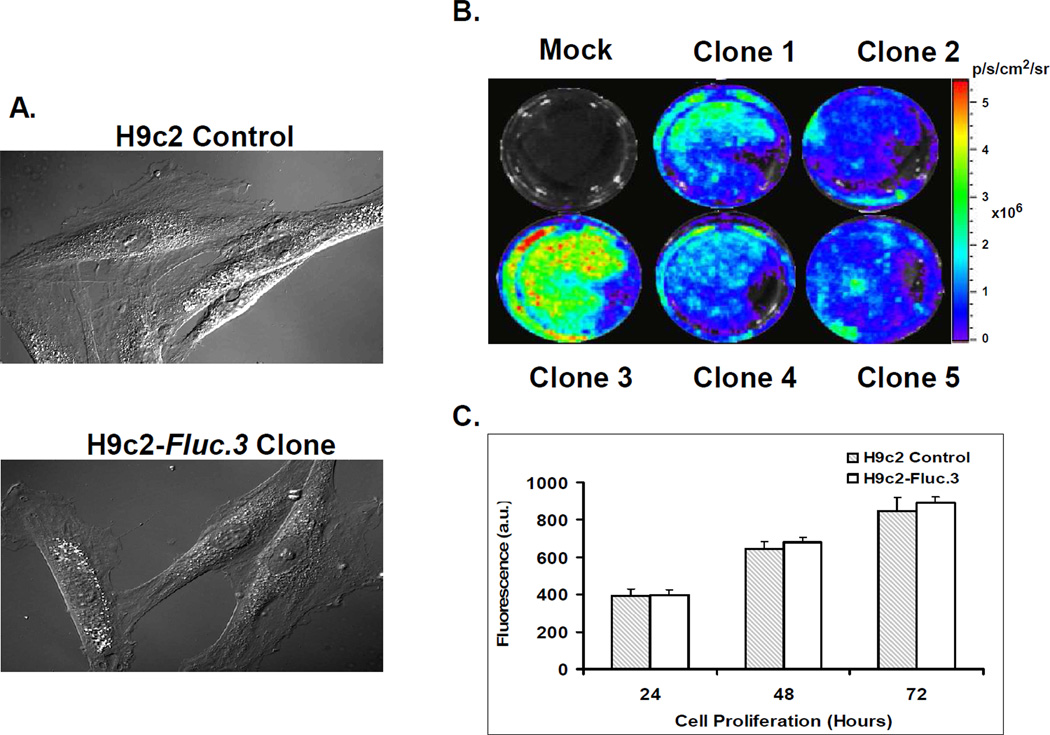
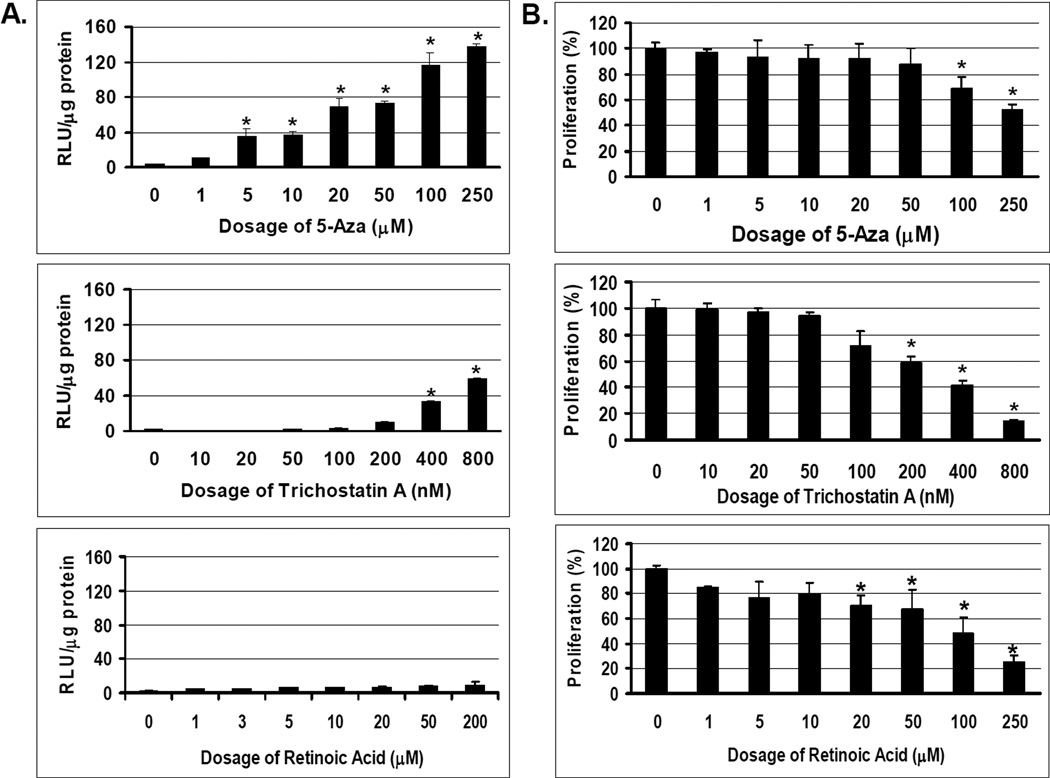
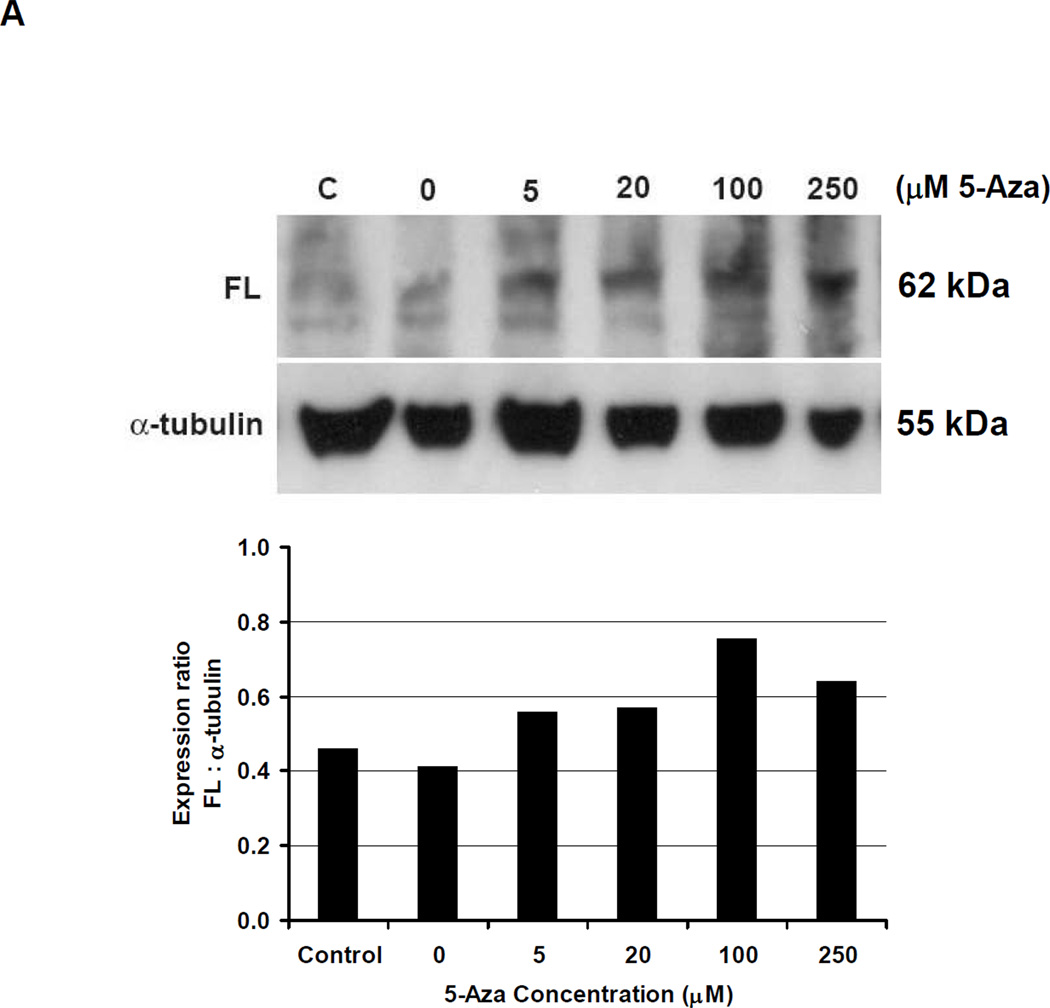
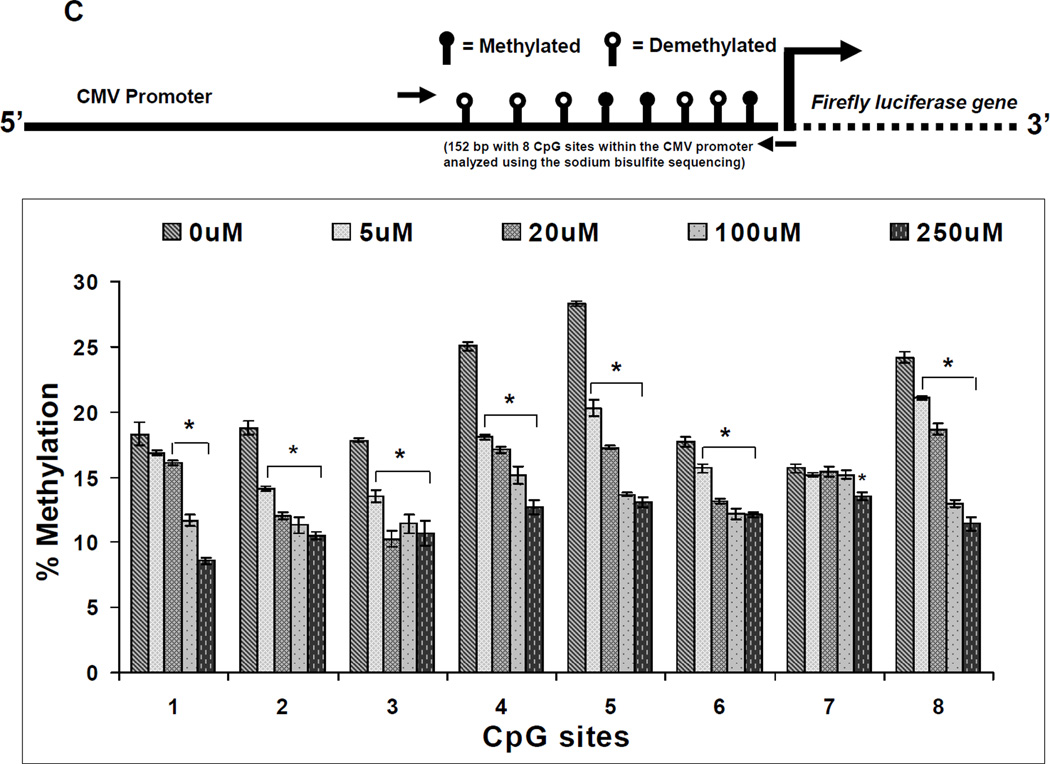
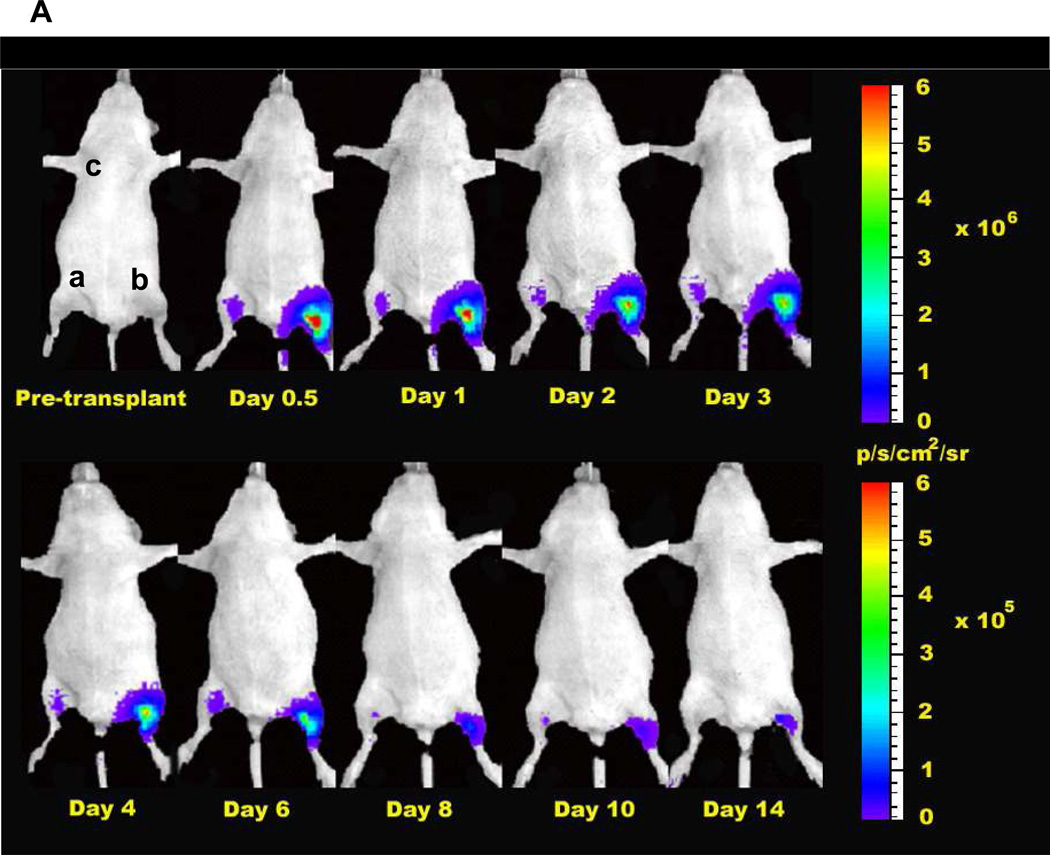
Tracking stem cell localization, survival, differentiation, and proliferation after transplantation in living subjects is essential for understanding stem cell biology and physiology. In this study, we investigated the long-term stability of reporter gene expression in an embryonic rat cardiomyoblast cell line and the role of epigenetic modulation on reversing reporter gene silencing. Cells were stably transfected with plasmids carrying cytomegalovirus promoter driving firefly luciferase reporter gene (CMV-Fluc) and passaged repeatedly for 3-8 months. Within the highest expressor clone, the firefly luciferase activity decreased progressively from passage 1 (843+/-28) to passage 20 (250+/-10) to passage 40 (44+/-3) to passage 60 (3+/-1 RLU/microg; P<0.05 vs. passage 1). Firefly luciferase activity was maximally rescued by treatment with 5-azacytidine (DNA methyltransferase inhibitor) compared with trichostatin A (histone deacetylase inhibitor) and retinoic acid (transcriptional activator; P<0.05). Increasing dosages of 5-azacytidine treatment led to higher levels of firefly luciferase mRNA (RT-PCR) and protein (Western blots) and inversely lower levels of methylation in the CMV promoter (DNA nucleotide sequence). These in vitro results were extended to in vivo bioluminescence imaging (BLI) of cell transplant in living animals. Cells treated with 5-azacytidine were monitored for 2 wk compared with 1 wk for untreated cells (P<0.05). These findings should have important implications for reporter gene-based imaging of stem cell transplantation.


Figures

Figure 1
Figure 1
Isolation and characterization of H9c2 clones stably expressing firefly luciferase. A Brightfield microscopy of control H9c2 (top) versus H9c2-Fluc clone (bottom) showed no gross difference in cellular morphology (400x magnification). B Emission of bioluminescence signals from H9c2-Fluc cells. After plasmid transfection with pCMV-Fluc-SV40-neofive stable H9c2-Fluc colonies were isolated, propagated, and cultured at 1×10⁵ cells per well density. Cellular FL enzyme activity was determined by adding the reporter probe D-Luciferin onto the 6-well plates. Bioluminescence imaging signals were acquired using the Xenogen IVIS 200 system. Clone number 3 (H9c2-Fluc.3) was found to have the most robust Fluc expression. Control H9c2 cells (mock) showed background bioluminescence signal only. C Effect of Fluc expression on the cellular physiology. The CyQuant assay showed no significant difference between control H9c2 and H9c2-Fluc.3 cell proliferation rate at 24, 48, and 72 hours as determined by fluorescence spectrophotometer.
Figure 2
Figure 2
Reversal of reporter gene silencing and toxicity effects of 5-azacytidine, trichostatin A, and retinoic acid. A Rescue of gene silencing in H9c2-Fluc.3 cells at 8 months was performed by treatment with different concentrations of DNA methyltransferase inhibitor 5-Aza (µM), histone deacetylase inhibitor TSA (nM), and transcriptional activator RA (µM). The FL activity was expressed as relative light unit per microgram protein (RLU/µg). B Cell proliferation rate of H9c2-Fluc.3 cells was assayed using a fluorescence spectrophotometer. The same condition was tested for all 3 agents. The cell proliferation rate of untreated H9c2-Fluc.3 was used as the control (100%). Adverse effect was stringently defined as a proliferation rate below 80% of control. In all cases, increasing dosage of treatment resulted in decreased proliferation rate. Error bar represents the standard deviation of each treatment dosage. *P<0.05 vs. untreated control.
Figure 3
Figure 3
Synergistic effect of combined drug treatment. H9c2-Fluc.3 cells treated with increasing dosages of 5-Aza, TSA, and RA showed increased FL induction. However, cell toxicity (<80% cell proliferation) was observed when drug dosages were above 10 µM of 5-Aza, 50 nM of TSA, and 10 µM of RA. Error bar represents the standard deviation of each treatment dosage. *P<0.05 vs. untreated control.
Figure 4
Figure 4
Post-transcriptional analysis of firefly luciferase expression. A Western blot of control H9c2 cells show absent FL as expected. H9c2-Fluc.3 at passage 60 showed progressive increases in FL levels with higher dosages of 5-Aza. The α-tubulin protein was used as the control. B RT-PCR of control H9c2 show absent Fluc mRNA as expected. H9c2-Fluc.3 at passage 60 showed progressive increases in Fluc levels with higher dosages of 5-Aza. The α-tubulin mRNA was used as the control. C Bisulfite genomic sequencing shows higher percentage of DNA methylation of the CMV promoter for untreated H9c2-Fluc.3 cells (0 µM). Treatment with 5-Aza reduced the percentage of DNA methylation at each of the 8 CpG sites examined (20 and 100 µM). *P<0.05 vs. untreated control.
Figure 4
Figure 4
Post-transcriptional analysis of firefly luciferase expression. A Western blot of control H9c2 cells show absent FL as expected. H9c2-Fluc.3 at passage 60 showed progressive increases in FL levels with higher dosages of 5-Aza. The α-tubulin protein was used as the control. B RT-PCR of control H9c2 show absent Fluc mRNA as expected. H9c2-Fluc.3 at passage 60 showed progressive increases in Fluc levels with higher dosages of 5-Aza. The α-tubulin mRNA was used as the control. C Bisulfite genomic sequencing shows higher percentage of DNA methylation of the CMV promoter for untreated H9c2-Fluc.3 cells (0 µM). Treatment with 5-Aza reduced the percentage of DNA methylation at each of the 8 CpG sites examined (20 and 100 µM). *P<0.05 vs. untreated control.
Figure 5
Figure 5
Noninvasive imaging of H9c2-Fluc.3 cells transplanted into the skeletal muscles of living rodents. A Optical bioluminescence imaging shows a representative rat transplanted with untreated H9c2-Fluc.3 cells at the right leg (a) versus 5-Aza treated H9c2-Fluc.3 cells at the left leg (b). FL signal was detected within the first 6 hours after transplant. Cell survival could be observed up to 14 days for 5-Aza treated cells compared to 8 days for untreated cells. Blank H9c2 cells injected into right arm (c) showed background signal as expected. B Cell survival rate after H9c2 transplantation as measured by in vivo optical bioluminescence imaging. In both groups, drastic reduction of cell signal intensity was observed within the first 2 weeks of transplant due to acute donor cell death.
Figure 5
Figure 5
Noninvasive imaging of H9c2-Fluc.3 cells transplanted into the skeletal muscles of living rodents. A Optical bioluminescence imaging shows a representative rat transplanted with untreated H9c2-Fluc.3 cells at the right leg (a) versus 5-Aza treated H9c2-Fluc.3 cells at the left leg (b). FL signal was detected within the first 6 hours after transplant. Cell survival could be observed up to 14 days for 5-Aza treated cells compared to 8 days for untreated cells. Blank H9c2 cells injected into right arm (c) showed background signal as expected. B Cell survival rate after H9c2 transplantation as measured by in vivo optical bioluminescence imaging. In both groups, drastic reduction of cell signal intensity was observed within the first 2 weeks of transplant due to acute donor cell death.

References

    1. Rafii S, Lyden D. Therapeutic stem and progenitor cell transplantation for organ vascularization and regeneration. Nat Med. 2003;9:702–712. - PubMed
    1. Lippincott-Schwartz J, Patterson GH. Development and use of fluorescent protein markers in living cells. Science. 2003;300:87–91. - PubMed
    1. Blasberg RG, Tjuvajev JG. Molecular-genetic imaging: current and future perspectives. J Clin Invest. 2003;111:1620–1629. - PMC - PubMed
    1. Aicher A, Brenner W, Zuhayra M, Badorff C, Massoudi S, Assmus B, Eckey T, Henze E, Zeiher AM, Dimmeler S. Assessment of the tissue distribution of transplanted human endothelial progenitor cells by radioactive labeling. Circulation. 2003;107:2134–2139. - PubMed
    1. Bulte JW, Douglas T, Witwer B, Zhang SC, Strable E, Lewis BK, Zywicke H, Miller B, van Gelderen P, Moskowitz BM, Duncan ID, Frank JA. Magnetodendrimers allow endosomal magnetic labeling and in vivo tracking of stem cells. Nat Biotechnol. 2001;19:1141–1147. - PubMed

Publication types

MeSH terms