. 2005 Oct 24;33(18):5781-98.
doi: 10.1093/nar/gki875. Print 2005.

Protein-DNA binding specificity predictions with structural models

Affiliations

Protein-DNA binding specificity predictions with structural models

Alexandre V Morozov et al. Nucleic Acids Res. .

Abstract

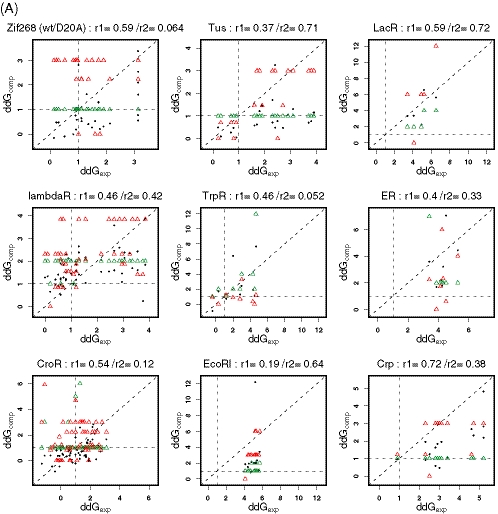
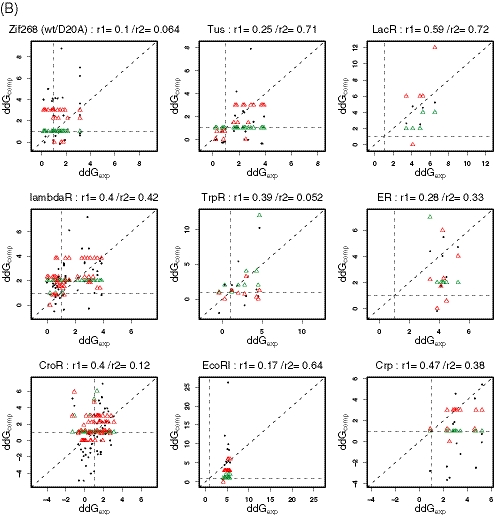
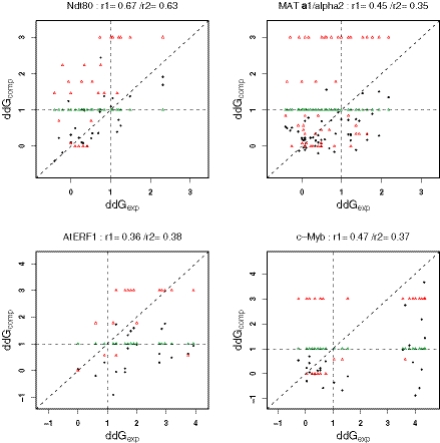
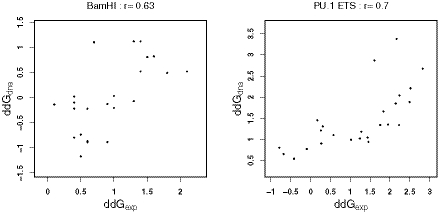
Protein-DNA interactions play a central role in transcriptional regulation and other biological processes. Investigating the mechanism of binding affinity and specificity in protein-DNA complexes is thus an important goal. Here we develop a simple physical energy function, which uses electrostatics, solvation, hydrogen bonds and atom-packing terms to model direct readout and sequence-specific DNA conformational energy to model indirect readout of DNA sequence by the bound protein. The predictive capability of the model is tested against another model based only on the knowledge of the consensus sequence and the number of contacts between amino acids and DNA bases. Both models are used to carry out predictions of protein-DNA binding affinities which are then compared with experimental measurements. The nearly additive nature of protein-DNA interaction energies in our model allows us to construct position-specific weight matrices by computing base pair probabilities independently for each position in the binding site. Our approach is less data intensive than knowledge-based models of protein-DNA interactions, and is not limited to any specific family of transcription factors. However, native structures of protein-DNA complexes or their close homologs are required as input to the model. Use of homology modeling can significantly increase the extent of our approach, making it a useful tool for studying regulatory pathways in many organisms and cell types.


Figures

Figure 1
Figure 1
ΔΔG predictions (ddGcomp) versus experimental measurements (ddGexp). (A) Static model binding energy predictions for the set of experimental measurements used in fitting static model weights. (B) Dynamic model binding energy predictions for the same set of experimental measurements. Closed circles, static/dynamic model; red triangles, contact model; green triangles, number of mutations from the consensus sequence. r1-Linear correlation coefficient for the static/dynamic model and r2-linear correlation coefficient for the contact model. Three Zif268 datasets from Table 1 [two for Zif268 wild-type (42,67) and one for Zif268 D20A mutant (67)] are combined into one panel.
Figure 1
Figure 1
ΔΔG predictions (ddGcomp) versus experimental measurements (ddGexp). (A) Static model binding energy predictions for the set of experimental measurements used in fitting static model weights. (B) Dynamic model binding energy predictions for the same set of experimental measurements. Closed circles, static/dynamic model; red triangles, contact model; green triangles, number of mutations from the consensus sequence. r1-Linear correlation coefficient for the static/dynamic model and r2-linear correlation coefficient for the contact model. Three Zif268 datasets from Table 1 [two for Zif268 wild-type (42,67) and one for Zif268 D20A mutant (67)] are combined into one panel.
Figure 2
Figure 2
ΔΔG predictions (ddGcomp) versus experimental measurements (ddGexp). Static model binding energy predictions for Ndt80, (34) MAT a1/α2, (30) AtERF1 (45) and c-Myb. (47) Closed circles, static model; red triangles, contact model; green triangles, number of mutations from the consensus sequence. r1-Linear correlation coefficient for the static model and r2-linear correlation coefficient for the contact model.
Figure 3
Figure 3
Experimental binding affinities conferred by indirect readout can be explained with DNA conformational energies alone. Dynamic model predictions of DNA base step energies (ddGdna) versus experimental binding free energies (ddGexp) for BamHI endonuclease (49) and PU.1 ETS domain (50).
Figure 4
Figure 4
Degree of pairwise additivity in binding energies predicted with the dynamic model. Comparison of binding energies computed after making multiple base pairs substitutions (ddGcomp) with the sum of binding energies computed for corresponding one-point mutations of the DNA site from the protein–DNA structure (ddGpw).
Figure 5
Figure 5
PWM predictions for Ndt80 (A) and Zif268 (B). From top to bottom: experiment, contact model based on the consensus sequence and the number of protein–DNA contacts, static model and dynamic model (see text for details). PWMs are displayed using the uniform height WebLogo representation(58): the height of each letter in the column is proportional to its probability in the PWM.
Figure 6
Figure 6
PWM predictions by homology for D.melanogaster TF bicoid (Bcd) (A) and giant (Gt) (B). From top to bottom: (A) panel 1: experiment; panels 2–4: contact model, static model with full energy function and static model with DNA conformational energy only (with dna–bp and dna–bs weights multiplied by 5) using D.melanogaster Engrailed homeodomain Q50K (2hdd) as a template; panels 5–7: contact model, dynamic model with full energy function (reference DNA energies are not subtracted since DNA is bent in homeodomains) and static model with DNA conformational energy only (with dna–bp and dna–bs weights multiplied by 5) using D.melanogaster Engrailed wild-type homeodomain (3hdd) as a template. (B) Experiment, contact model, static model and dynamic model using Homo sapiens nuclear factor NF-IL6 (C/EBP-β;1gu4) as a template. All amino acids substituted at the protein–DNA interface are repacked in the static model. PWMs are displayed using the uniform height WebLogo representation (58).

References

    1. Bulyk M. Computational prediction of transcription-factor binding site locations. Genome Biol. 2003;5:201. - PMC - PubMed
    1. Stormo G.D. DNA binding sites: representation and discovery. Bioinformatics. 2000;16:16–23. - PubMed
    1. Siggia E.D. Computational methods for transcriptional regulation. Curr. Opin. Genet. Dev. 2005;15:214–221. - PubMed
    1. Seeman N.C., Rosenberg J.M., Rich A. Sequence-specific recognition of double helical nucleic acids by proteins. Proc. Natl Acad. Sci. USA. 1976;73:804–808. - PMC - PubMed
    1. Suzuki M., Yagi N. DNA recognition code of transcription factors in the helix–turn–helix, probe helix, hormone receptor, and zinc finger families. Proc. Natl Acad. Sci. USA. 1994;91:12357–12361. - PMC - PubMed

Publication types