Pore conformations and gating mechanism of a Cys-loop receptor
- PMID: 16247006
- PMCID: PMC1276086
- DOI: 10.1073/pnas.0507599102
Pore conformations and gating mechanism of a Cys-loop receptor
Abstract
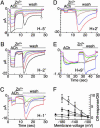
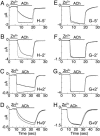
Neurons regulate the propagation of chemoelectric signals throughout the nervous system by opening and closing ion channels, a process known as gating. Here, histidine-based metal-binding sites were engineered along the intrinsic pore of a chimeric Cys-loop receptor to probe state-dependent Zn(2+)-channel interactions. Patterns of Zn(2+) ion binding within the pore reveal that, in the closed state, the five pore-lining segments adopt an oblique orientation relative to the axis of ion conduction and constrict into a physical gate at their intracellular end. The interactions of Zn(2+) with the open state indicate that the five pore-lining segments should rigidly tilt to enable the movement of their intracellular ends away from the axis of ion conduction, so as to open the constriction (i.e., the gate). Alignment of the functional results with the 3D structure of an acetylcholine receptor allowed us to generate structural models accounting for the closed and open pore conformations and for a gating mechanism of a Cys-loop receptor.
Figures


Similar articles
-
Structure of the acetylcholine-gated channel.Novartis Found Symp. 2002;245:5-15; discussion 15-21, 165-8. Novartis Found Symp. 2002. PMID: 12027014 Review.
-
A hydrophobic gate in an ion channel: the closed state of the nicotinic acetylcholine receptor.Phys Biol. 2006 Jul 7;3(2):147-59. doi: 10.1088/1478-3975/3/2/007. Phys Biol. 2006. PMID: 16829701
-
A stepwise mechanism for acetylcholine receptor channel gating.Nature. 2007 Apr 19;446(7138):930-3. doi: 10.1038/nature05721. Nature. 2007. PMID: 17443187
-
Cis-trans isomerization at a proline opens the pore of a neurotransmitter-gated ion channel.Nature. 2005 Nov 10;438(7065):248-52. doi: 10.1038/nature04130. Nature. 2005. PMID: 16281040
-
The Cys-loop superfamily of ligand-gated ion channels: the impact of receptor structure on function.Biochem Soc Trans. 2004 Jun;32(Pt3):529-34. doi: 10.1042/BST0320529. Biochem Soc Trans. 2004. PMID: 15157178 Review.
Cited by
-
Atomic structure and dynamics of pentameric ligand-gated ion channels: new insight from bacterial homologues.J Physiol. 2010 Feb 15;588(Pt 4):565-72. doi: 10.1113/jphysiol.2009.183160. Epub 2009 Dec 7. J Physiol. 2010. PMID: 19995852 Free PMC article. Review.
-
Chloride ions in the pore of glycine and GABA channels shape the time course and voltage dependence of agonist currents.J Neurosci. 2011 Oct 5;31(40):14095-106. doi: 10.1523/JNEUROSCI.1985-11.2011. J Neurosci. 2011. PMID: 21976494 Free PMC article.
-
Structural answers and persistent questions about how nicotinic receptors work.Front Biosci. 2008 May 1;13:5479-510. doi: 10.2741/3094. Front Biosci. 2008. PMID: 18508600 Free PMC article. Review.
-
An inactivation gate in the selectivity filter of KCNQ1 potassium channels.Biophys J. 2007 Dec 15;93(12):4159-72. doi: 10.1529/biophysj.107.107987. Epub 2007 Aug 17. Biophys J. 2007. PMID: 17704175 Free PMC article.
-
Mechanics of channel gating of the nicotinic acetylcholine receptor.PLoS Comput Biol. 2008 Jan;4(1):e19. doi: 10.1371/journal.pcbi.0040019. PLoS Comput Biol. 2008. PMID: 18225945 Free PMC article.
References
-
- Changeux, J.-P. (1990) in Fidia Research Foundation Neuroscience Award Lectures (Raven, New York), Vol. 4, pp. 21-168.
-
- Betz, H. (1990) Neuron 5, 383-392. - PubMed
-
- Karlin, A. (2002) Nat. Rev. Neurosci. 3, 102-114. - PubMed
-
- Lester, H. A., Dibas, M. I., Dahan, D. S., Leite, J. F. & Dougherty, D. A. (2004) Trends Neurosci. 27, 329-336. - PubMed
-
- Unwin, N. (1995) Nature 373, 37-43. - PubMed
Publication types
MeSH terms
Substances
LinkOut - more resources
Full Text Sources

