. 2005 Oct 24;171(2):383-92.
doi: 10.1083/jcb.200503017.

The mechanisms and dynamics of (alpha)v(beta)3 integrin clustering in living cells

Affiliations

The mechanisms and dynamics of (alpha)v(beta)3 integrin clustering in living cells

Caroline Cluzel et al. J Cell Biol. .

Abstract

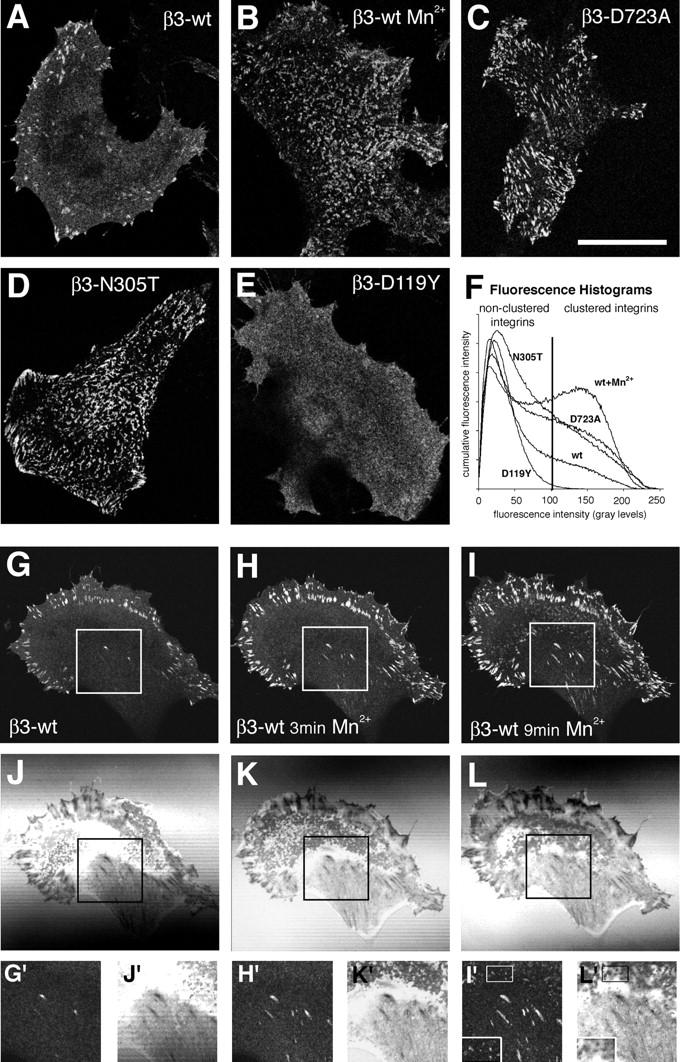
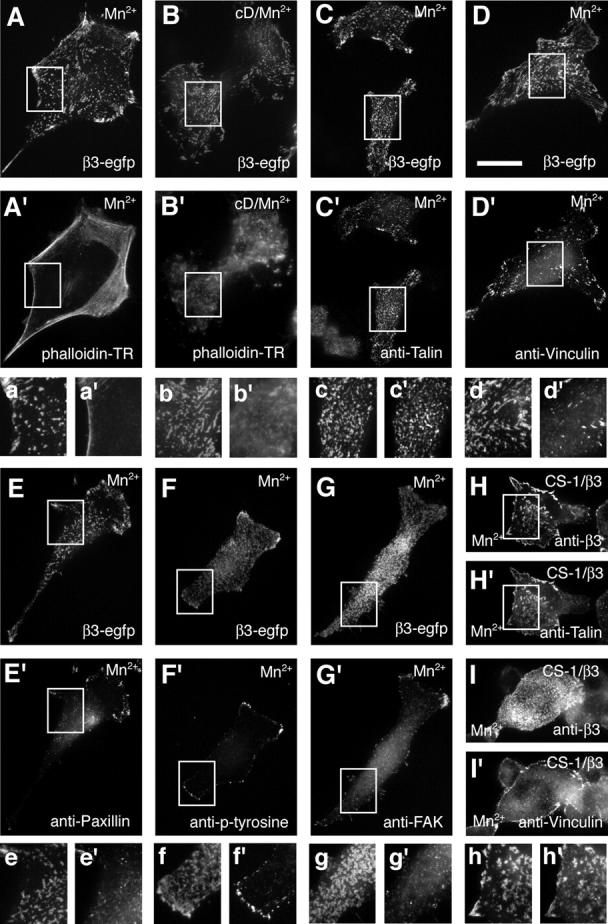
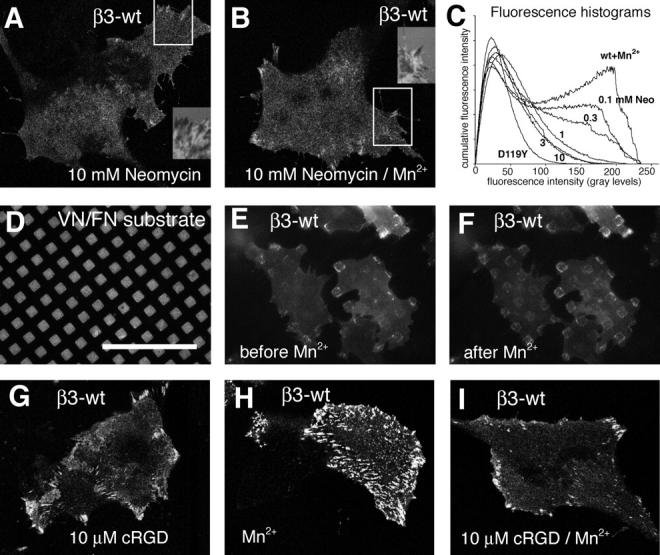
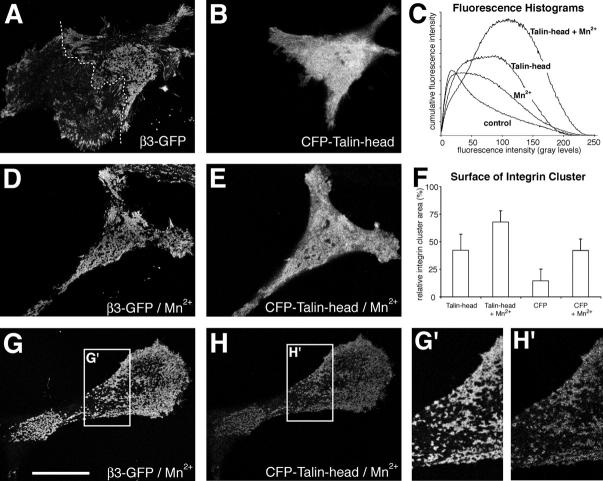
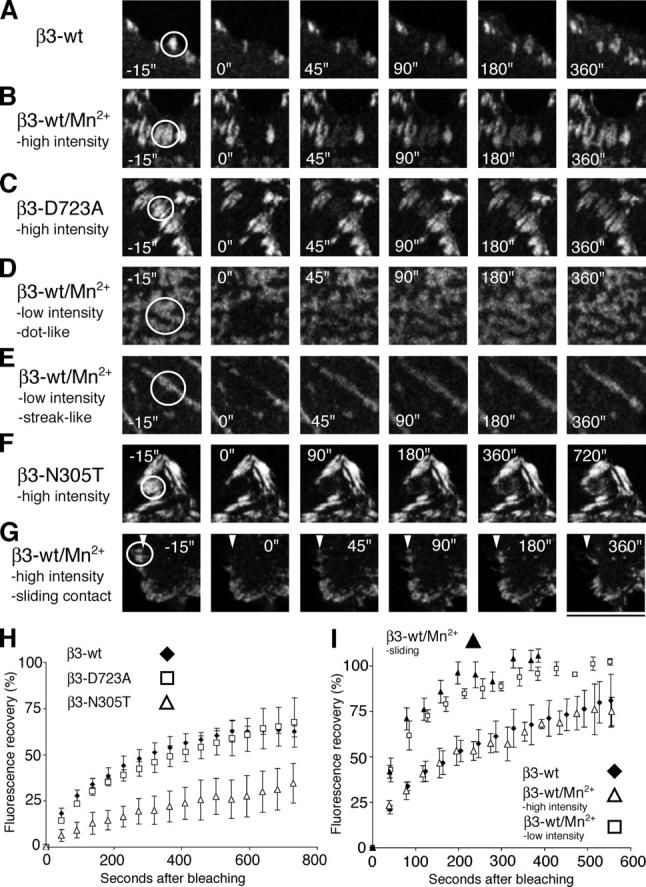
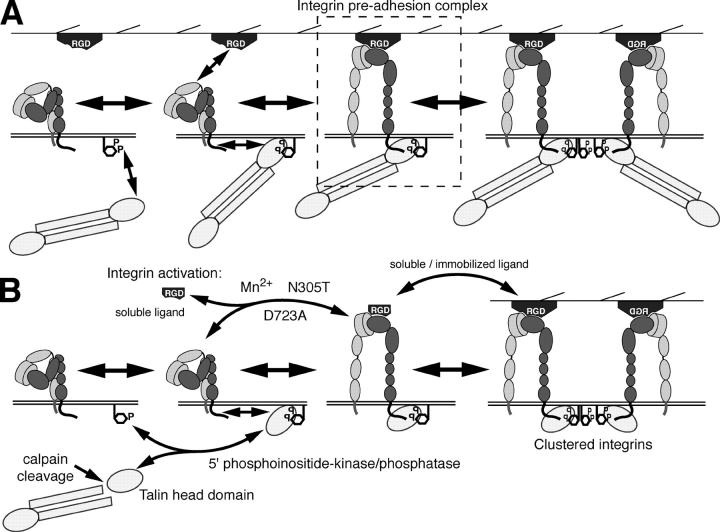
During cell migration, the physical link between the extracellular substrate and the actin cytoskeleton mediated by receptors of the integrin family is constantly modified. We analyzed the mechanisms that regulate the clustering and incorporation of activated alphavbeta3 integrins into focal adhesions. Manganese (Mn2+) or mutational activation of integrins induced the formation of de novo F-actin-independent integrin clusters. These clusters recruited talin, but not other focal adhesion adapters, and overexpression of the integrin-binding head domain of talin increased clustering. Integrin clustering required immobilized ligand and was prevented by the sequestration of phosphoinositole-4,5-bisphosphate (PI(4,5)P2). Fluorescence recovery after photobleaching analysis of Mn(2+)-induced integrin clusters revealed increased integrin turnover compared with mature focal contacts, whereas stabilization of the open conformation of the integrin ectodomain by mutagenesis reduced integrin turnover in focal contacts. Thus, integrin clustering requires the formation of the ternary complex consisting of activated integrins, immobilized ligands, talin, and PI(4,5)P2. The dynamic remodeling of this ternary complex controls cell motility.


Figures

Figure 1.
Figure 1.
Increased clustering of high-affinity integrins. Confocal images at the level of the ventral cell surface of mouse B16F1 melanoma cells stably transfected with WT (A and B), D723A (C), N305T (D), or D119Y (E) mutant β3-EGFP integrin. Cells were grown in control medium (A and C–E) or stimulated for 20 min in 0.5 mM of Mn2+-containing medium (B). Note the increased number of integrin clusters at the cell surfaces underlying the main cell body in B–D. (F) Quantification of the relative amount of integrin clustering by histogram analysis. Averaged (n > 20) cumulative histograms from cells as shown in A–E (Fig. S1). The vertical line represents the fluorescence threshold corresponding to 99% of the histogram area of the inactive integrin D119Y mutant. Confocal (G–I) and corresponding interference reflection images (J–L) of Mn2+-induced integrin clustering in a B16F1 cell cultured overnight in serum-containing medium. (G and J) The cell before Mn2+ addition; (H and K) the cell after 3 min of Mn2+ addition; (I and L) the cell after 9 min of Mn2+ addition. Magnified views of the area underneath the main cell body representing de novo–formed dot- and streaklike integrin clusters are represented in insets G′–L′. Bars: (A–E) 25 μm; (G–L) 37.5 μm.
Figure 2.
Figure 2.
F-actin–independent integrin clustering and talin recruitment. Epifluorescence of fixed B16F1 and CS-1 cells exhibiting de novo formed β3 integrin clusters. Integrin fluorescence (A and B) and phalloidin stained F-actin (A' and B') in 0.5 mM of Mn2+-treated cells (20 min; A and A') or 10 μg/ml of cD/Mn2+-treated B16F1 cells (25 min of cD, followed by 20 min of cD/Mn2+; B and B'). Immunohistochemical analysis of focal adhesion adaptor proteins recruited to Mn2+-induced clusters of β3-EGFP integrins in B16F1 cells (C–G) and nontagged β3 integrins in CS-1 cells (H and I). Pairs of images show the distribution of the EGFP integrin fluorescence (C–G) or anti-β3 staining (H and I) and the respective immunohistochemical localization of talin (C' and H'), vinculin (D' and I'), paxillin (E'), phosphotyrosine (F'), and FAK (G'). Corresponding magnified views of the boxed areas in A–H and A'–H' are shown below each image pair (a–h and a'–h'). Bar, 25 μm.
Figure 3.
Figure 3.
PI(4,5)P 2 and immobilized ligand are required for integrin clustering. (A and B) Stable β3-EGFP integrin–expressing B16F1 cells were cultured in neomycin sulfate–containing medium for 36 h. Control (A) or Mn2+-stimulated (B) cells were fixed and analyzed by confocal microscopy. The corresponding inset represents the IRM image of the boxed region of the cell in A and B, respectively. (C) Averaged histograms (n > 20) of Mn2+-induced integrin clustering in respect to increasing concentrations of neomycin sulfate. The histogram analysis of the inactive integrin mutant D119Y (Fig. 1 F) is shown as a negative reference. (D–F) Integrin clustering on a micropatterned substrate of vitronectin/fibronectin. Epifluorescence images of Alexa 568–labeled fibronectin (D) and corresponding β3-EGFP integrin fluorescence of B16F1 cells before Mn2+ addition (E). The same cells were imaged 10 min after treatment with Mn2+ (F). Note the exclusive accumulation of de novo integrin clusters on ECM-coated, but not noncoated, surfaces. (G–I) Inhibition of de novo integrin clustering in the presence of cRGD. Stable β3-EGFP integrin–expressing B16F1 cells were cultured overnight in complete medium and fixed 20 min after the addition of 10 μM cRGD (G), 0.5 mM Mn2+ (H), or both reagents (I). Confocal images of the integrin fluorescence at the level of the glass coverslip indicate the inhibition of Mn2+-induced integrin clustering by cRGD. Bars: (A,B, and G–I) 35 μm; (D–F) 50 μm.
Figure 4.
Figure 4.
The head domain of talin induces β3 integrin clustering. Cells stably expressing β3-EGFP integrin were transiently transfected with enhanced cyan fluorescent protein (ECFP)-tagged human NH2-terminal talin head domain and cultured in complete medium. 48 h after transfection, cells were fixed and observed by confocal microscopy. Talin head domain transfected control (A and B) or Mn2+-treated cells (20 min; 0.5 mM final concentration; D and E) revealed extensive integrin clustering (A and D). (C) Histogram analysis of integrin clustering in talin head transfected cells with or without the addition of Mn2+. (F) Analysis of the relative cell surface occupied by β3-EGFP integrin clusters in cells transfected with ECFP-talin head domain or empty ECFP vector and treated with or without Mn2+. Error bars represent the standard deviation of at least 20 double-transfected cells. (G and H) Confocal images of β3-EGFP integrin and ECFP-talin head domain in a Mn2+-stimulated, weakly talin-expressing cell. Note the similar staining pattern between integrins and the talin head domain (G' and H'). Data for graphs in C and F are from one out of three similar experiments. Bar, 27 μm.
Figure 5.
Figure 5.
FRAP of activated integrins. FRAP analysis of β3 integrin dynamics within stationary or sliding peripheral high-intensity focal contacts and de novo formed dot- or streaklike integrin clusters in B16F1 cells. The analysis was performed in stably transfected EGFP-tagged WT (β3-wt), D723A (β3-D723A), or N305T (β3-N305T) cells. FRAP sequences of peripheral focal contacts in control cells (β3-wt; A), Mn2+-treated cells (β3-wt/Mn2+; B), and cells expressing D723A-activated β3 integrin (β3-D723A; C; Videos 1–3). FRAP sequences of de novo formed dot- (D) and streaklike (E) low-intensity integrin clusters in Mn2+-treated cells (Video 4). FRAP sequences of stationary peripheral focal contacts in cells expressing N305T-activated β3 integrin (β3-N305T; F; Video 5). Note the twofold expanded time range in F. FRAP sequence of WT β3 integrins in sliding focal contacts of Mn2+-stimulated cells (β3-wt/Mn2+; G; Video 6). Arrowheads in G indicate the position of the inner edge of the sliding contact before bleaching. (H) Comparison of the FRAP curves of peripheral focal contacts in WT (β3-wt, diamonds) or by mutationally activated β3-EGFP integrins (β3-D723A, squares; β3-N305T, open triangles), respectively. (I) Comparison of FRAP curves of control (diamonds) or Mn2+-treated (open triangles) peripheral high intensity focal contacts, as well as Mn2+-induced de novo, dotlike, low-intensity integrin clusters (squares). Superimposed on this graph is the increase in integrin fluorescence at the inner edge of bleached, inward-sliding focal contacts (filled triangles). Error bars correspond to the standard deviation of three independent experiments with each comprising at least three cells. Bars: (A–C) 7.4 μm; (D and E) 5.4 μm; (F) 8 μm; (G) 10.7 μm.
Figure 6.
Figure 6.
Model of αvβ3 integrin activation and clustering. (A) Schematic view of a sequence of integrin activation and clustering. Talin is recruited and activated by membrane exposed PI(4,5)P2 lipids. Binding of the talin–PI(4,5)P2 complex to the cytoplasmic domain of integrin induces its “inside-out” activation (unfolding) allowing it to bind to immobilized extracellular ligands. Alternatively, integrins can interact with its extracellular ligands leading to “outside-in” activation and subsequent recruitment of PI(4,5)P2-bound talin, resulting in the formation of an “integrin preadhesion complex.” Subsequent clustering of this ternary complex is mediated by multivalent PI(4,5)P2-containing lipid domains. (B) Alternative modes of integrin activation, such as by the head domain of talin in response to calpain-mediated proteolytic cleavage or by low concentrations of soluble ligand (Legler et al., 2001), Mn2+, and activating mutations (N305T and D723A). These activation pathways can be modulated by the sequestration (Laux et al., 2000), synthesis, or degradation of PI(4,5)P2 lipids or by high doses of soluble ligands.

References

    1. Arbuzova, A., K. Martushova, G. Hangyas-Mihalyne, A.J. Morris, S. Ozaki, G.D. Prestwich, and S. McLaughlin. 2000. Fluorescently labeled neomycin as a probe of phosphatidylinositol-4,5-bisphosphate in membranes. Biochim. Biophys. Acta. 1464:35–48. - PubMed
    1. Ballestrem, C., B. Hinz, B.A. Imhof, and B. Wehrle-Haller. 2001. Marching at the front and dragging behind: differential αVβ3-integrin turnover regulates focal adhesion behavior. J. Cell Biol. 155:1319–1332. - PMC - PubMed
    1. Barsukov, I.L., A. Prescot, N. Bate, B. Patel, D.N. Floyd, N. Bhanji, C.R. Bagshaw, K. Letinic, G. Di Paolo, P. De Camilli, et al. 2003. Phosphatidylinositol phosphate kinase type 1gamma and beta1-integrin cytoplasmic domain bind to the same region in the talin FERM domain. J. Biol. Chem. 278:31202–31209. - PubMed
    1. Calderwood, D.A., B. Yan, J.M. de Pereda, B.G. Alvarez, Y. Fujioka, R.C. Liddington, and M.H. Ginsberg. 2002. The phosphotyrosine binding-like domain of talin activates integrins. J. Biol. Chem. 277:21749–21758. - PubMed
    1. Chen, J., A. Salas, and T.A. Springer. 2003. Bistable regulation of integrin adhesiveness by a bipolar metal ion cluster. Nat. Struct. Biol. 10:995–1001. - PubMed

Publication types