Differential gene expression, GATA1 target genes, and the chemotherapy sensitivity of Down syndrome megakaryocytic leukemia
- PMID: 16249385
- PMCID: PMC1895418
- DOI: 10.1182/blood-2005-06-2219
Differential gene expression, GATA1 target genes, and the chemotherapy sensitivity of Down syndrome megakaryocytic leukemia
Abstract
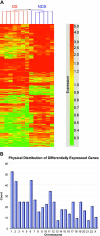
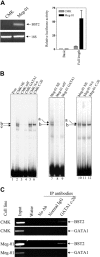
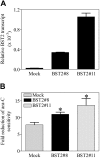
Children with Down syndrome (DS) with acute megakaryocytic leukemia (AMkL) have very high survival rates compared with non-DS AMkL patients. Somatic mutations identified in the X-linked transcription factor gene, GATA1, in essentially all DS AMkL cases result in the synthesis of a shorter (40 kDa) protein (GATA1s) with altered transactivation activity and may lead to altered expression of GATA1 target genes. Using the Affymetrix U133A microarray chip, we identified 551 differentially expressed genes between DS and non-DS AMkL samples. Transcripts for the bone marrow stromal-cell antigen 2 (BST2) gene, encoding a transmembrane glycoprotein potentially involved in interactions between leukemia cells and bone marrow stromal cells, were 7.3-fold higher (validated by real-time polymerase chain reaction) in the non-DS compared with the DS group. Additional studies confirmed GATA1 protein binding and transactivation of the BST2 promoter; however, stimulation of BST2 promoter activity by GATA1s was substantially reduced compared with the full-length GATA1. CMK sublines, transfected with the BST2 cDNA and incubated with HS-5 bone marrow stromal cells, exhibited up to 1.7-fold reduced cytosine arabinoside (ara-C)-induced apoptosis, compared with mock-transfected cells. Our results demonstrate that genes that account for differences in survival between DS and non-DS AMkL cases may be identified by microarray analysis and that differential gene expression may reflect relative transactivation capacities of the GATA1s and full-length GATA1 proteins.
Figures


Similar articles
-
A unique role of GATA1s in Down syndrome acute megakaryocytic leukemia biology and therapy.PLoS One. 2011;6(11):e27486. doi: 10.1371/journal.pone.0027486. Epub 2011 Nov 16. PLoS One. 2011. PMID: 22110660 Free PMC article.
-
GATA1, cytidine deaminase, and the high cure rate of Down syndrome children with acute megakaryocytic leukemia.J Natl Cancer Inst. 2005 Feb 2;97(3):226-31. doi: 10.1093/jnci/dji026. J Natl Cancer Inst. 2005. PMID: 15687366
-
The role of cytidine deaminase and GATA1 mutations in the increased cytosine arabinoside sensitivity of Down syndrome myeloblasts and leukemia cell lines.Cancer Res. 2004 Jan 15;64(2):728-35. doi: 10.1158/0008-5472.can-03-2456. Cancer Res. 2004. PMID: 14744791
-
Down syndrome and malignancies: a unique clinical relationship: a paper from the 2008 william beaumont hospital symposium on molecular pathology.J Mol Diagn. 2009 Sep;11(5):371-80. doi: 10.2353/jmoldx.2009.080132. J Mol Diagn. 2009. PMID: 19710397 Free PMC article. Review.
-
Acute Megakaryocytic Leukemia.Cold Spring Harb Perspect Med. 2020 Feb 3;10(2):a034884. doi: 10.1101/cshperspect.a034884. Cold Spring Harb Perspect Med. 2020. PMID: 31548219 Free PMC article. Review.
Cited by
-
Towards integrated oncogenic marker recognition through mutual information-based statistically significant feature extraction: an association rule mining based study on cancer expression and methylation profiles.Quant Biol. 2017 Dec;5(4):302-327. doi: 10.1007/s40484-017-0119-0. Epub 2017 Nov 23. Quant Biol. 2017. PMID: 30221015 Free PMC article.
-
Targeting the wee1 kinase for treatment of pediatric Down syndrome acute myeloid leukemia.Pediatr Blood Cancer. 2014 Oct;61(10):1767-73. doi: 10.1002/pbc.25081. Epub 2014 Jun 24. Pediatr Blood Cancer. 2014. PMID: 24962331 Free PMC article.
-
The role of BST-2/Tetherin in host protection and disease manifestation.Immun Inflamm Dis. 2015 Dec 7;4(1):4-23. doi: 10.1002/iid3.92. eCollection 2016 Mar. Immun Inflamm Dis. 2015. PMID: 27042298 Free PMC article. Review.
-
Overexpression of GATA1 confers resistance to chemotherapy in acute megakaryocytic Leukemia.PLoS One. 2013 Jul 10;8(7):e68601. doi: 10.1371/journal.pone.0068601. Print 2013. PLoS One. 2013. PMID: 23874683 Free PMC article.
-
CD11c+CD88+CD317+ myeloid cells are critical mediators of persistent CNS autoimmunity.Proc Natl Acad Sci U S A. 2021 Apr 6;118(14):e2014492118. doi: 10.1073/pnas.2014492118. Proc Natl Acad Sci U S A. 2021. PMID: 33785592 Free PMC article.
References
-
- Taub JW. Relationship of chromosome 21 and acute leukemia in children with Down syndrome. J Pediatr Hematol Oncol. 2001;23: 175-178. - PubMed
-
- Athale UH, Razzouk BI, Raimondi SC, et al. Biology and outcome of childhood acute megakaryoblastic leukemia: a single institution's experience. Blood. 2001;97: 3727-3732. - PubMed
-
- Lange BJ, Kobrinsky N, Barnard DR, et al. Distinctive demography, biology, and outcome of acute myeloid leukemia and myelodysplastic syndrome in children with Down syndrome: Children's Cancer Group Studies 2861 and 2891. Blood. 1998;91: 608-615. - PubMed
-
- Zipursky A, Thorner P, De Harven E, Christensen H, Doyle J. Myelodysplasia and acute megakaryoblastic leukemia in Down's syndrome. Leuk Res. 1994;18: 163-171. - PubMed
-
- Ravindranath Y, Abella E, Krischer J, et al. Acute myeloid leukemia (AML) in Down's syndrome is highly responsive to chemotherapy: experience on Pediatric Oncology Group AML study 8498. Blood. 1992;80: 2210-2214. - PubMed
Publication types
MeSH terms
Substances
Grants and funding
LinkOut - more resources
Full Text Sources
Other Literature Sources
Medical
Research Materials
Miscellaneous

