. 2006 Jan;17(1):498-510.
doi: 10.1091/mbc.e04-12-1096. Epub 2005 Oct 26.

Visualization of vacuolar acidification-induced transcription of genes of pathogens inside macrophages

Affiliations

Visualization of vacuolar acidification-induced transcription of genes of pathogens inside macrophages

Natalia Martin-Orozco et al. Mol Biol Cell. 2006 Jan.

Abstract

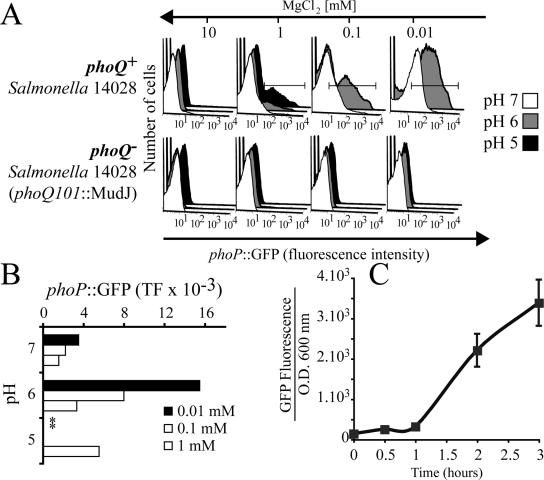
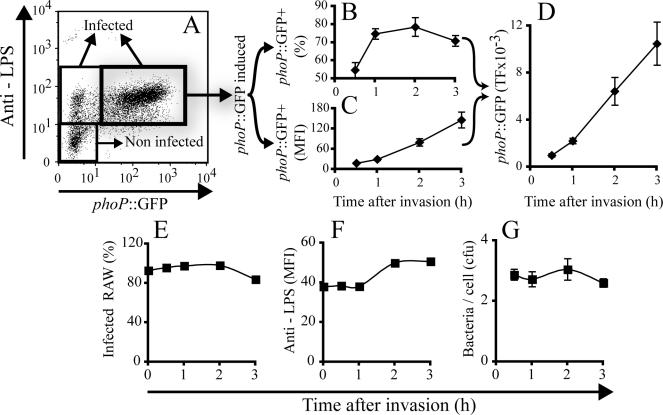
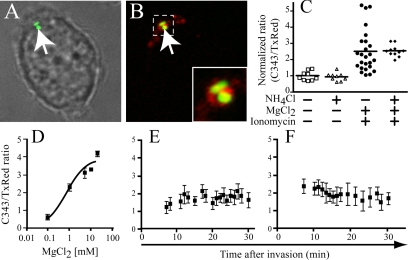
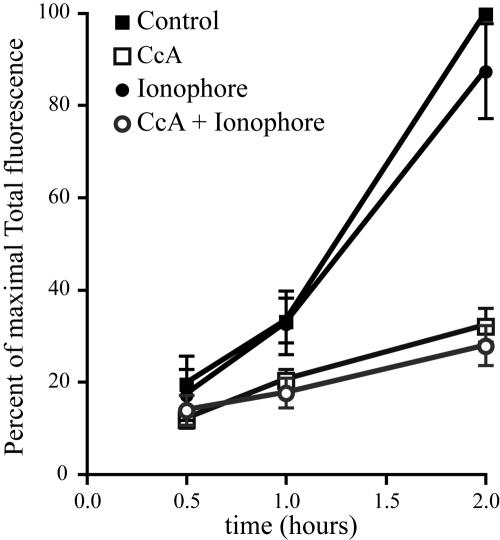
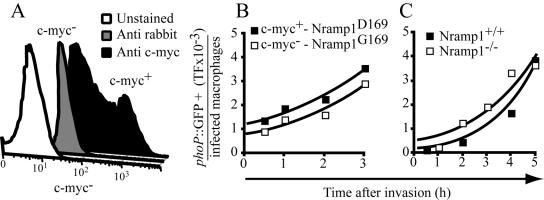
The objective of these studies was to analyze the role of the ionic environment of phagosomal vacuoles in the control of pathogens by macrophages. Digital imaging and flow cytometry were used to follow the induction of the phoP promoter of Salmonella enterica Typhimurium within live macrophages. Manipulating the Mg2+ concentration within the Salmonella-containing vacuole (SCV) was without effect on the early induction of PhoPQ. Moreover, direct measurement of [Mg2+] within the SCV using nanosensor particles showed that, during this initial period of phoP activation, the concentration of the divalent cation is rapidly regulated and stabilizes around 1 mm. Extrusion of other divalent cations via the Nramp1 efflux pump was similarly ruled out as an important contributor to the activation of the regulon. By contrast, induction of PhoP was greatly attenuated when the pH gradient across the SCV membrane was dissipated. A second, more modest pH-independent component of PhoP induction was unmasked by inhibition of the vacuolar proton pump. This second component was eliminated by pretreatment of cells with IFNgamma, even though the cytokine augmented the overall PhoP response. These findings demonstrate the existence of at least three separate activators of phoP transcription: resting and IFNgamma-stimulated pH-sensitive components, plus a pH-independent component.


Figures

Figure 1.
Figure 1.
Expression of phoP::GFP by Salmonella Typhimurium in media of varying [Mg2+] and pH. Salmonella Typhimurium 14028 phoQ+ and the mutant phoQ101::MudJ phoQ- were transformed with the plasmid pMLZ205 that encodes phoP::GFP. A small inoculum was grown in medium M9 supplemented with the indicated MgCl2 concentration and adjusted to the specified pH. After 5 h of culture, the bacteria were harvested and fluorescence was analyzed by flow cytometry. (A) Representative histograms of one experiment; (B) quantitation of total fluorescence from histograms like those shown in A (TF, mean fluorescence multiplied by the % of GFP-positive bacteria). Where indicated by asterisks, bacterial viability was compromised and fluorescence was not quantified. Similar results were obtained in three independent experiments. (C) Time course of GFP expression in phoP::GFP Salmonella suspended in M9 minimal medium with 0.01 mm MgCl2 at pH 6.0. Aliquots of the suspension were withdrawn at the indicated times and GFP fluorescence and optical density at 600 nm were measured as described in Materials and Methods. Data are representative of three similar experiments.
Figure 2.
Figure 2.
Expression of phoP::GFP by Salmonella Typhimurium inside macrophages. (A-D) RAW264.7 macrophages were infected with Salmonella Typhimurium-pMLZ205 at a MOI of 10. After 60 min, the cells were fixed and extracellular bacteria were identified by labeling with anti-LPS antibodies, followed by fluorescent secondary antibody (blue in A and D). Presence of extracellular bacteria after 60 min is extremely rare, but one such case is shown here to illustrate that external bacteria do not express GFP. The cells were next permeabilized and total bacteria were labeled with primary and secondary antibodies, as above (red in B and D). The fluorescence of GFP was directly visualized (green in C and D). (E) RAW264.7 macrophages were infected with Salmonella Typhimurium-pMLZ205 for 15 min at a MOI of 10, followed by removal of extracellular bacteria and addition of 5 μM gentamicin. After the indicated periods, the cells were fixed, permeabilized, and stained with anti-LPS and secondary antibody as above. Cells were analyzed by flow cytometry, gating on the population of live macrophages (90%) based on their characteristic forward and side scattering properties. Dot plots (scattergrams) show the number of cell-associated bacteria (identified by anti-LPS; ordinate) versus the expression of GFP (abscissa) as a function of time after infection. The values in the insets indicate the percentage of infected macrophages where phoP::GFP is induced. Data are representative of eight similar experiments. MFI, mean fluorescence intensity of GFP in the gated population.
Figure 3.
Figure 3.
Analysis of phoP::GFP expression in Salmonella-infected RAW264.7 macrophages. (A) Definition of the different subpopulations of cells in a typical dot plot. Noninfected cells have LPS staining indistinguishable from untreated cells, whereas infected cells have significantly higher levels of LPS signal. Infected cells were subdivided into those that had negligible phoP::GFP induction (insignificant green fluorescence) and those with distinct induction. (B) Fraction of cells expressing phoP::GFP as a function of time after invasion; (C) mean fluorescence intensity (MFI) of the subpopulation of phoP::GFP expressing cells as a function of time. (D) Total fluorescence (TF), calculated as the product of the MFI times the fraction of cells expressing phoP::GFP. (E) Fraction of infected cells. (F) Quantitation of LPS staining, a measure of bacterial number. (G) Quantitation of viable bacteria recovered from infected cultures, performed by cell lysis and plating of lysates on LB agar plates. Data in B-D are a compilation of eight independent experiments, and E, F, and G is one representative experiment of eight experiments with similar results.
Figure 4.
Figure 4.
Assessment of the role of [Mg2+] in PhoPQ induction. (A-C) RAW264.7 macrophages were bathed in medium containing the indicated [Mg2+] and were infected with Salmonella Typhimurium-pMLZ205 at a MOI of 10 for 15 min. Extracellular bacteria were washed and the infected cells were incubated for the indicated times. The total GFP fluorescence (TF), calculated as in Figure 2 is shown in A, whereas the fraction of infected cells is presented in B and the proportion of macrophages where phoP::GFP is induced is shown in C. Data are representative of five experiments with similar results.
Figure 5.
Figure 5.
Measurements of [Mg2+] in SCV using PEBBLEs. (A and B) Imaging of RAW264.7 macrophages incubated for 5 min with PEBBLEs and a Salmonella strain that expresses GFP constitutively. After washing, DIC and confocal fluorescence images were acquired. (A) An overlay of the DIC and green fluorescence images, illustrating the location of bacteria (arrow) within an infected cell. (B) An overlay of the green (bacterial) and red (TxRed in PEBBLEs) fluorescence. The area denoted by the dotted line is enlarged in the inset. (C) RAW264.7 macrophages were loaded with PEBBLEs and the fluorescence of C343 and TxRed was determined by digital imaging under various conditions. Cells were initially bathed in a NaCl buffer deprived of Mg2+ (leftmost column). The cells were then treated with either 10 mm NH4Cl, a combination of 10 mm MgCl2 and 1 μM ionomycin, or all three agents, as indicated. Data from three experiments are illustrated. The ratio of C343 to TxRed was normalized to facilitate comparison between experiments. (D) In vitro calibration of PEBBLEs. The fluorescence ratio of the C343 and TxRed signals (ordinate) is presented as a function of [Mg2+] (abscissa). (E and F) Determination of free [Mg2+] in the SCV. SCV were loaded with PEBBLEs during infection and their fluorescence ratio was monitored over time by digital imaging, while identifying the location of the bacteria by their DAPI fluorescence (see Materials and Methods). The [Mg2+] of the medium in E and F was 0.5 mm and 2 mm, respectively. Data in E and F are means ± SE of 10 determinations for each time point, obtained from four independent experiments.
Figure 6.
Figure 6.
Effect of an imposed elevation of vacuolar [Mg2+] on PhoPQ induction. Intracellular induction of phoP::GFP was monitored by flow cytometry in RAW cells infected with Salmonella Typhimurium pMLZ205 for 15 min and then otherwise untreated (▪), treated with 10 mm MgCl2 plus 4 μM A23187 (•), 30 nm CcA (□), or a combination of CcA, elevated MgCl2 and A23187 (sh=cir). The mean total fluorescence ± SE of at least four different experiments is expressed as percent of the maximal induction of the control for each experiment.
Figure 7.
Figure 7.
Assessment of the contribution of Nramp1 to the induction of PhoPQ. (A) Identification of cells transfected with Nramp1(G169) by immunostaining of the c-myc epitope tag. Flow cytometric histograms of unstained cells (white), cells stained with the secondary antibody only (gray histogram), and cells with both anti-myc and secondary antibody (black histogram) are shown. (B) RAW264.7 cells expressing Nramp1(G169) or Nramp1(D169) were infected with Salmonella Typhimurium pMLZ205 for 15 min using a MOI of 10. Extracellular bacteria were washed and the infected cells incubated for the indicated times. The total green fluorescence (TF) was measured as in Figure 3. (C) Peritoneal macrophages elicited from either Nramp1-/- and Nramp1+/+ mice were infected with Salmonella Typhimurium transformed with phoP::GFP (MOI = 10) as above, and TF was measured cytometrically. Data in A and B are representative of five independent experiments.
Figure 8.
Figure 8.
Assessment of the role of vacuolar pH in PhoPQ induction. (A) Experimental design. The diagram indicates when concanamycin A (CcA; 30 nm) was added to the cells with respect to the time of infection. N.T., not-treated with CcA. Note that each protocol corresponds to one of the symbols used in B-E. (B-D) RAW264.7 macrophages subjected to the specific protocol described in A were infected with Salmonella Typhimurium pMLZ205 at a MOI of 10 for 15 min and analyzed by flow cytometry at the specified times. (B) Total fluorescence; (C) mean fluorescence intensity of infected cells; (D) percentage of cells expressing GFP. Data in B-D are representative of five similar experiments. (E) Quantitation of viable bacteria recovered from infected cultures, performed by cell lysis and plating of lysates on LB agar plates. Data in E are means ± SE of three independent experiments with triplicates for each determination.
Figure 9.
Figure 9.
Effect of pretreatment with IFNγ on PhoPQ induction. RAW264.7 macrophages were either pretreated for 18 h with 100 U of IFNγ (triangles) or were left untreated (squares). The cells were infected with Salmonella Typhimurium transformed with phoP::GFP and analyzed by flow cytometry as above. Where indicated, the cells were in addition treated with CcA immediately after invasion (as for the open squares in Figures 7 and 8). (A) Quantitation of viable bacteria recovered from infected cultures, performed by cell lysis and plating of lysates on LB agar plates; (B) total fluorescence. (C) Percentage of inhibition of phoP::GFP expression by IFN-γ, CcA and the combination of both IFN-γ and CcA. (D) Fluorescence normalized per bacterium, per cell. Data shown in A, B, and D are representative of five similar experiments and C is a compilation of five independent experiments.

Similar articles

Cited by

References

    1. Alpuche Aranda, C. M., Swanson, J. A., Loomis, W. P., and Miller, S. I. (1992). Salmonella typhimurium activates virulence gene transcription within acidified macrophage phagosomes. Proc. Natl. Acad. Sci. USA 89, 10079-10083. - PMC - PubMed
    1. Amer, A. O., and Swanson, M. S. (2002). A phagosome of one's own: a microbial guide to life in the macrophage. Curr. Opin. Microbiol. 5, 56-61. - PubMed
    1. Bader, M. W., Navarre, W. W., Shiau, W., Nikaido, H., Frye, J. G., McClelland, M., Fang, F. C., and Miller, S. I. (2003). Regulation of Salmonella typhimurium virulence gene expression by cationic antimicrobial peptides. Mol. Microbiol. 50, 219-230. - PubMed
    1. Bader, M. W., Sanowar, S., Daley, M. E., Schneider, A. R., Cho, U., Xu, W., Klevit, R. E., Le Moual, H., and Miller, S. I. (2005). Recognition of antimicrobial peptides by a bacterial sensor kinase. Cell 122, 461-472. - PubMed
    1. Bearson, B. L., Wilson, L., and Foster, J. W. (1998). A low pH-inducible, PhoPQ-dependent acid tolerance response protects Salmonella typhimurium against inorganic acid stress. J. Bacteriol. 180, 2409-2417. - PMC - PubMed

MeSH terms