. 2005 Nov;167(5):1193-205.
doi: 10.1016/S0002-9440(10)61208-4.

Origin of interstitial fibroblasts in an accelerated model of angiotensin II-induced renal fibrosis

Affiliations

Origin of interstitial fibroblasts in an accelerated model of angiotensin II-induced renal fibrosis

Jennifer L Faulkner et al. Am J Pathol. 2005 Nov.

Abstract

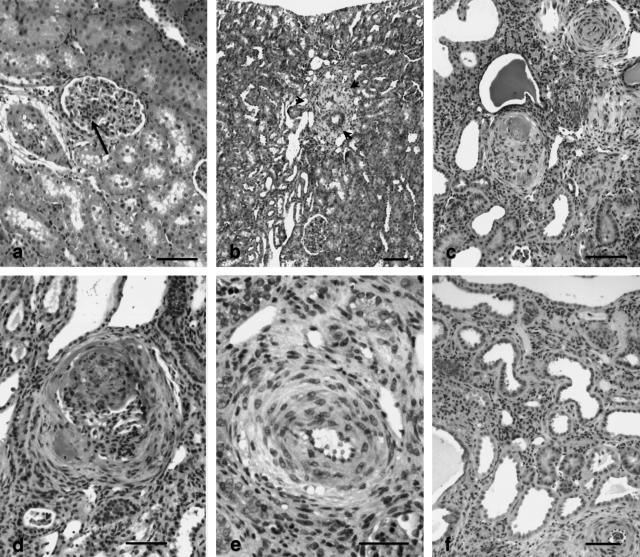
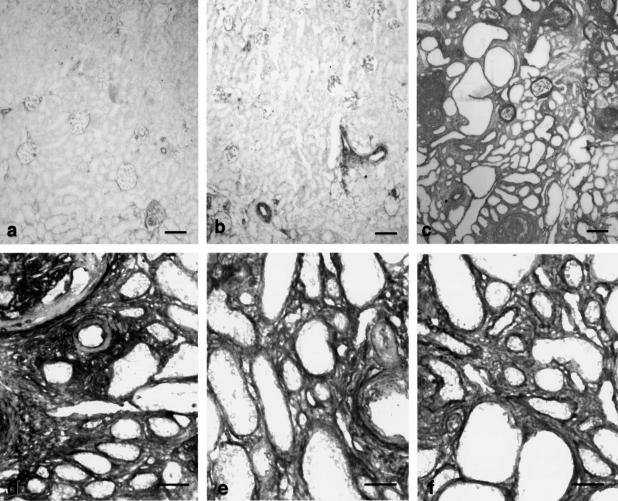
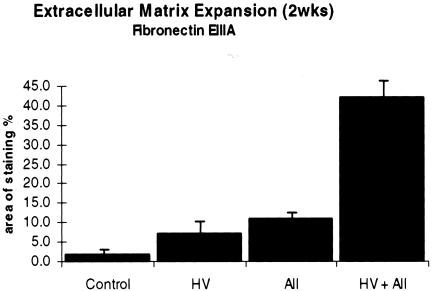
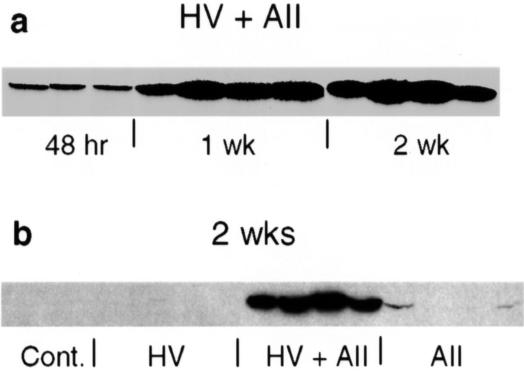
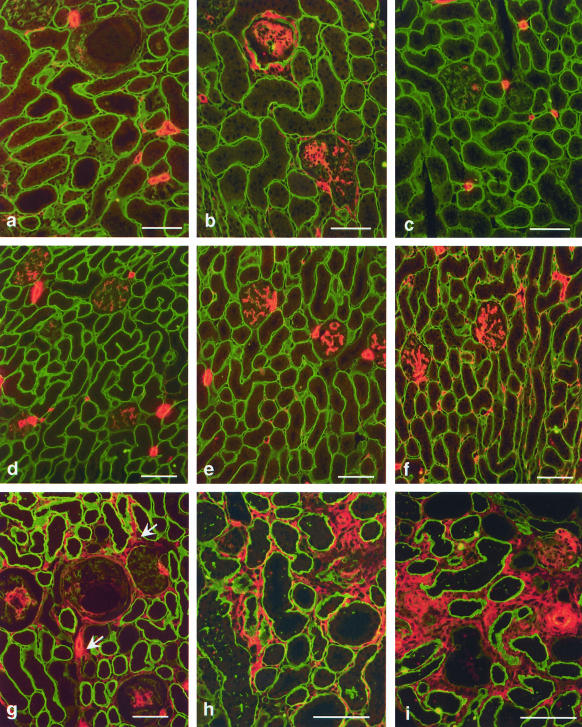
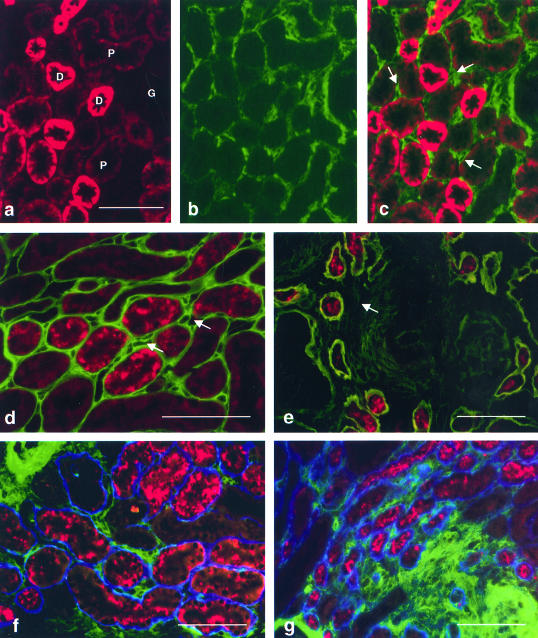
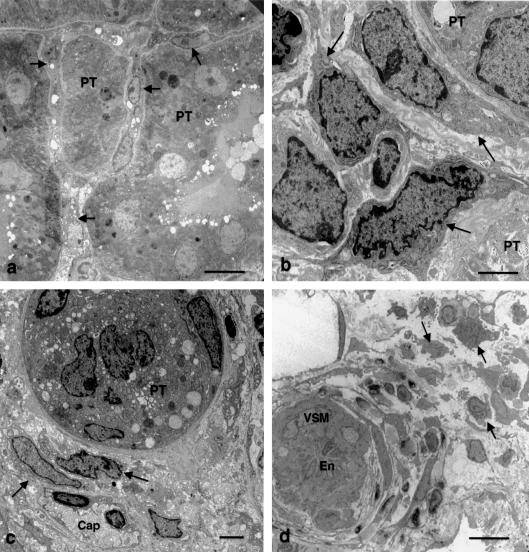
To determine whether previous renal injury accelerates the progression of glomerulosclerosis and interstitial fibrosis, we examined the effect of treating rats with angiotensin II after Habu venom injury. After initiating disease, we examined the origin of interstitial myofibroblasts by locating alpha-smooth muscle actin (alpha-SMA)-positive and Na+,K+-ATPase-positive cells relative to interstitial space, tubular epithelial cells, the tubular basement membrane (TBM), and vascular structures. Tubular epithelial-mesenchymal transition was also assessed by examining TBM integrity and by using Texas Red (TR)-dextran in intravital tracking experiments. The staining of alpha-SMA-positive myofibroblasts dramatically increased in peritubular interstitial spaces 48 hours after Habu venom plus angiotensin II, particularly in and around perivascular and periglomerular regions, while tubular epithelial cells were alpha-SMA-negative. Na+,K+-ATPase-positive and TR-dextran-labeled cells were restricted to the tubular epithelium and excluded from the interstitium. By 7 and 14 days, expanded interstitial space contained only alpha-SMA-positive myofibroblasts without TR-dextran endocytic particles. Epithelium of atrophic tubules containing TR-dextran remained confined by surrounding interstitium and myofibroblasts. These studies indicate that early expansion of alpha-SMA-positive cells in the interstitium and loss of tubular area occur via encroachment of interstitial myofibroblasts from perivascular into atrophic tubular spaces rather than via epithelial-mesenchymal transition and migration of tubular cells through the TBM into the interstitium.


Figures

Figure 1
Figure 1
Histopathology of rat kidneys 14 days after treatment with HV alone (a), Ang II infusion alone (b), or HV + Ang II infusion (c–f). a: Lesions 14 days after HV are characterized by resolving mesangial proliferative nodules (arrow) and no noticeable interstitial disease. b: Ang II infusion alone results in small foci of interstitial fibrosis adjacent to vessels (arrows) with minimal glomerular histological changes. c: Combined treatment with HV + Ang II results in dilated and atrophic renal tubules, glomerulosclerosis, and interstitial fibrosis. d–f: Higher magnification of HV + Ang II-induced nephropathy illustrates mesangioproliferative glomerulonephritis and crescents (d), a small artery with a thickened media and expanded adventitia (e), and tubulointerstitial hypercellularity and fibrosis (f). H&E stain. Scale bars: 100 μm (a–d, f); 50 μm (e).
Figure 2
Figure 2
a–d: ECM accumulation illustrated by immunoperoxidase expression of Fn-EIIIA protein in kidney sections from rats 14 days after administration of HV alone (a), Ang II alone (b), and HV + Ang II (c, d). e and f: Accumulation of collagens type I (e) and type IV (f). Matrix proteins are abundant HV + Ang II relative to HV or Ang II treatments alone. Sections lightly counterstained with hematoxylin. Scale bars: 100 μm (a–c); 50 μm (d–f).
Figure 3
Figure 3
Quantitative image analysis of matrix accumulation at 2 weeks based on the total area of the kidney occupied by Fn-EIIIA protein by immunohistochemistry. Area occupied by Fn-EIIIA in sections from HV + AII was 42% versus HV alone (7%), AII alone (11%), or controls (2%).
Figure 4
Figure 4
Western blot analysis of α-SMA expression in renal cortical lysates throughout the course of HV + Ang II-induced renal fibrosis, showing progressive increments in protein expression (a) and in comparison with controls, HV alone, and Ang II infusion alone at 14 days (b).
Figure 5
Figure 5
Dual-label immunofluorescence micrographs of kidneys stained for α-SMA (red) relative to the TBM (laminin, green) in rats treated with HV (a–c), Ang II (d–f), and HV + Ang II (g–i) at 48 hours (a, d, g), and 7 (b, e, h) and 14 (c, f, i) days. α-SMA in glomerular and interstitial lesions after HV diminishes by 14 days. In rats given Ang II alone, mesangial and interstitial expression of α-SMA increases throughout time, but without substantial histopathological lesions by H&E. Combination of HV + Ang II results in an abundant expression of α-SMA-positive myofibroblasts in glomeruli and the interstitium reflecting the progressive fibrosis observed by H&E in Figure 1. Scale bars, 100 μm.
Figure 6
Figure 6
Expression of Na+,K+-ATPase (a) and α-SMA (b), and a merged image (c) by dual-label immunofluorescence at 48 hours after HV + Ang II. Na+,K+-ATPase is present exclusively in epithelia of proximal (P) and distal (D) tubular compartments, but not in the interstitium or glomeruli (G). α-SMA is present exclusively within the interstitium as indicated in their respective monochrome and in merged (c) photomicrographs. TR-dextran experiments show staining in proximal tubules, but not in interstitial cells in two-color merged images using laminin as a marker for the TBM (FITC-second antibody) at 48 hours (d) and 7 days (e) after HV + Ang II. Triple-dye immunofluorescence at 48 hours (f) and 7 days (g) after HV + Ang II shows myofibroblasts (FITC-mouse anti-α-SMA-positive cells) in interstitial spaces without co-localization of TR-dextran. The TBM stains blue with AMCA sheep anti-BM in tri-colored merged images. Scale bars, 100 μm.
Figure 7
Figure 7
Electron micrographs showing myofibroblasts (arrows) surrounding proximal tubules (PT) at 48 hours (a, b) and 7 days (c) after HV + Ang II. The perivascular and interstitial space is expanded and filled with numerous myofibroblasts. c: Epithelial cells show evidence of apoptosis including vacuolization, loss of brush border, nuclear abnormalities, and reduction in size. d: Expanded perivascular space shows numerous adventitial cells/myofibroblasts (arrows). En, Endothelium. Scale bars: 10 μm (a, d); 2 μm (b, c).

Similar articles

Cited by

References

    1. Border WA, Noble NA. Interactions of transforming growth factor-beta and angiotensin II in renal fibrosis. Hypertension. 1998;31:181–188. - PubMed
    1. Klahr S, Morrissey JJ. Comparative study of ACE inhibitors and angiotensin II receptor antagonists in interstitial scarring. Kidney Int. 1997;52:S111–S114. - PubMed
    1. Wolf G, Neilson EG. Angiotensin II as a renal growth factor. J Am Soc Nephrol. 1993;3:1531–1540. - PubMed
    1. Klahr S, Morrissey JJ. The role of vasoactive compounds, growth factors and cytokines in the progression of renal disease. Kidney Int. 2000;57:S7–S14. - PubMed
    1. Matsusaka T, Hymes J, Ichikawa I. Angiotensin in progressive renal diseases: theory and practice. J Am Soc Nephrol. 1996;7:2025–2043. - PubMed

MeSH terms