

Gene expression profiles reveal increased mClca3 (Gob5) expression and mucin production in a murine model of asbestos-induced fibrogenesis
- PMID: 16251409
- PMCID: PMC1603789
- DOI: 10.1016/S0002-9440(10)61212-6
Gene expression profiles reveal increased mClca3 (Gob5) expression and mucin production in a murine model of asbestos-induced fibrogenesis
Abstract
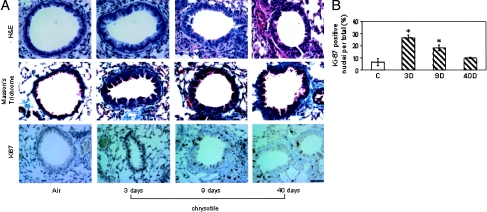
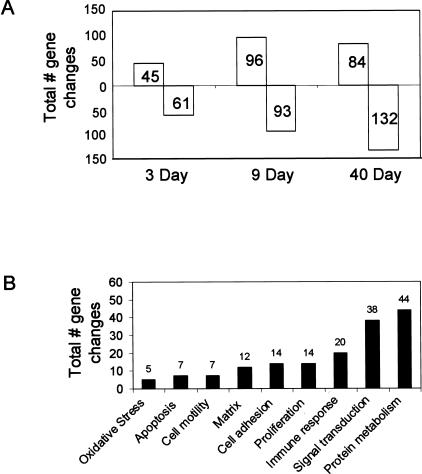
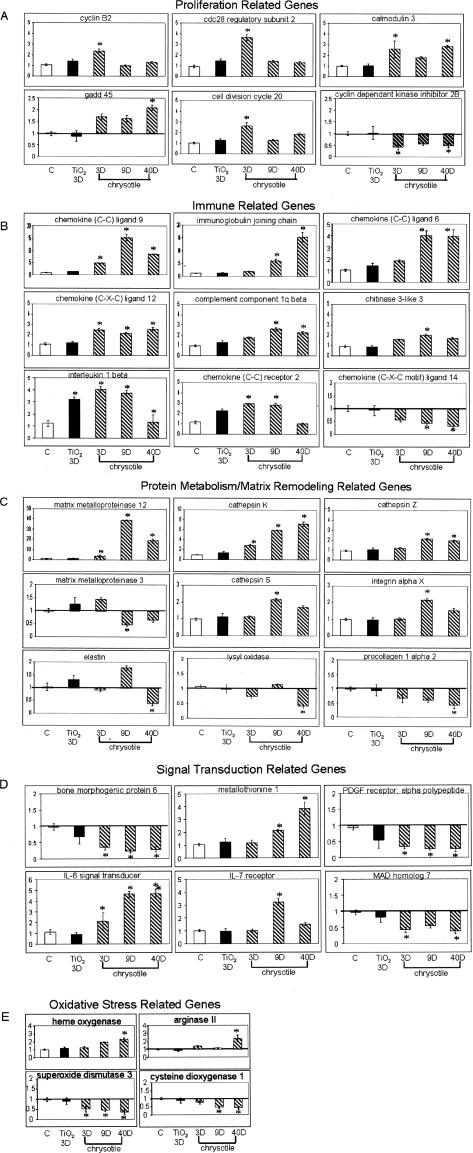
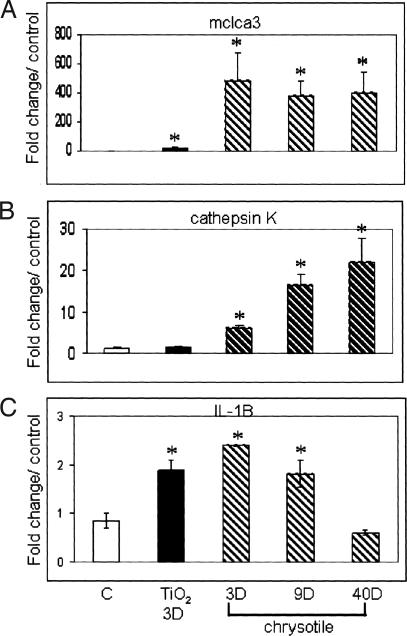
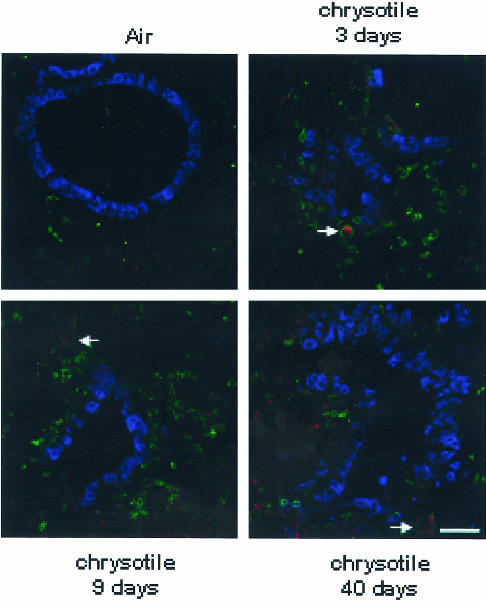
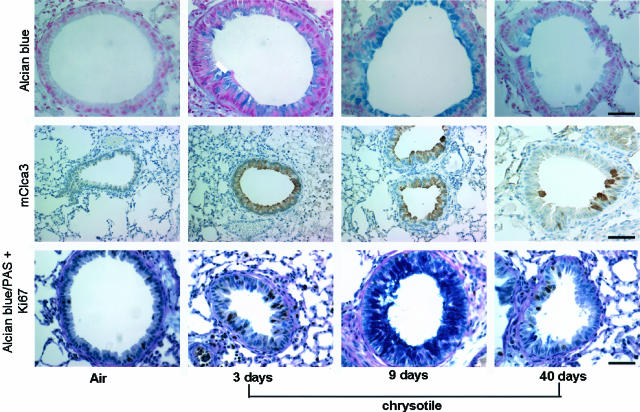
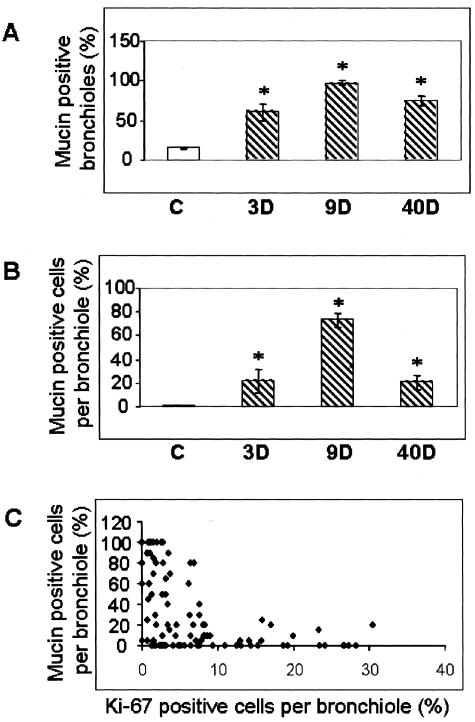
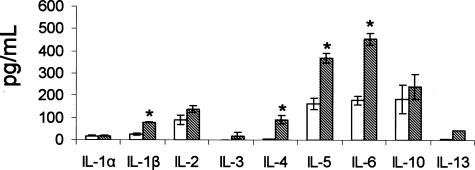
To elucidate genes important in development or repair of asbestos-induced lung diseases, gene expression was examined in mice after inhalation of chrysotile asbestos for 3, 9, and 40 days. We identified changes in the expression of genes linked to proliferation (cyclin B2, CDC20, and CDC28 protein kinase regulatory subunit 2), inflammation (CCL9, CCL6, complement component 1, chitinase3-like 3, TNF superfamily member 10, and IL-1B), and matrix remodeling (MMP12, MMP3, integrin alphaX, and cathepsins K, Z, B, and S). The most highly induced gene at all time points was mclca3 (gob5), a putative calcium-activated chloride channel involved in the regulation of mucus production and/or secretion. Using histochemistry, we demonstrated accumulation of mucus and increased mClca3 protein in the bronchiolar epithelium of asbestos-exposed mice at all time points but peaking at 9 days. Cytokine levels (interleukin-1beta, interleukin-4, interleukin-6) in bronchoalveolar lavage fluid also increased at 9 days, suggesting Th2-mediated immunity may play a role in asbestos-induced mucus production. In contrast, levels of cathepsin K, a potent elastase, increased between 3 and 40 days at both the mRNA and protein levels, localizing primarily in CD45-positive leukocytes and interstitial cells. Identification of genes involved in lung injury and remodeling after asbestos exposure could aid in defining mechanisms of airborne particulate-induced disease and in developing therapeutic strategies.
Figures
Similar articles
-
Osteopontin modulates inflammation, mucin production, and gene expression signatures after inhalation of asbestos in a murine model of fibrosis.Am J Pathol. 2011 May;178(5):1975-85. doi: 10.1016/j.ajpath.2011.01.048. Am J Pathol. 2011. PMID: 21514415 Free PMC article.
-
mCLCA3 modulates IL-17 and CXCL-1 induction and leukocyte recruitment in murine Staphylococcus aureus pneumonia.PLoS One. 2014 Jul 17;9(7):e102606. doi: 10.1371/journal.pone.0102606. eCollection 2014. PLoS One. 2014. PMID: 25033194 Free PMC article.
-
Airway epithelial NF-kappaB activation modulates asbestos-induced inflammation and mucin production in vivo.J Immunol. 2007 Feb 1;178(3):1800-8. doi: 10.4049/jimmunol.178.3.1800. J Immunol. 2007. PMID: 17237430
-
Cellular and molecular mechanisms of asbestos-induced fibrosis.J Cell Physiol. 1999 Aug;180(2):158-66. doi: 10.1002/(SICI)1097-4652(199908)180:2<158::AID-JCP3>3.0.CO;2-R. J Cell Physiol. 1999. PMID: 10395285 Review.
-
Analyzing the genes and peptide growth factors expressed in lung cells in vivo consequent to asbestos exposure and in vitro.Environ Health Perspect. 1997 Sep;105 Suppl 5(Suppl 5):1165-71. doi: 10.1289/ehp.97105s51165. Environ Health Perspect. 1997. PMID: 9400718 Free PMC article. Review.
Cited by
-
The NLRP3 inflammasome in pathogenic particle and fibre-associated lung inflammation and diseases.Part Fibre Toxicol. 2016 Sep 20;13(1):51. doi: 10.1186/s12989-016-0162-4. Part Fibre Toxicol. 2016. PMID: 27650313 Free PMC article. Review.
-
Molecular basis of asbestos-induced lung disease.Annu Rev Pathol. 2013 Jan 24;8:161-87. doi: 10.1146/annurev-pathol-020712-163942. Annu Rev Pathol. 2013. PMID: 23347351 Free PMC article. Review.
-
Single-walled carbon nanotubes modulate pulmonary immune responses and increase pandemic influenza a virus titers in mice.Virol J. 2017 Dec 22;14(1):242. doi: 10.1186/s12985-017-0909-z. Virol J. 2017. PMID: 29273069 Free PMC article.
-
Chronic intermittent hypoxia decreases pulmonary clearance of 99mTc-labelled particulate matter in mice.Am J Transl Res. 2017 Jun 15;9(6):3060-3072. eCollection 2017. Am J Transl Res. 2017. PMID: 28670393 Free PMC article.
-
Effect of Surface Modification on the Pulmonary and Systemic Toxicity of Cellulose Nanofibrils.Biomacromolecules. 2022 Jul 11;23(7):2752-2766. doi: 10.1021/acs.biomac.2c00072. Epub 2022 Jun 9. Biomacromolecules. 2022. PMID: 35680128 Free PMC article.
References
-
- Craighead JE. The epidemiology and pathogenesis of malignant mesothelioma. Chest. 1989;96:92S–93S. - PubMed
-
- Craighead JE. Do silica and asbestos cause lung cancer? Arch Pathol Lab Med. 1992;116:16–20. - PubMed
-
- Mossman BT, Bignon J, Corn M, Seaton A, Gee JB. Asbestos: scientific developments and implications for public policy. Science. 1990;247:294–301. - PubMed
-
- Hei TK, Piao CQ, He ZY, Vannais D, Waldren CA. Chrysotile fiber is a strong mutagen in mammalian cells. Cancer Res. 1992;52:6305–6309. - PubMed
-
- Mossman BT, Churg A. Mechanisms in the pathogenesis of asbestosis and silicosis. Am J Respir Crit Care Med. 1998;157:1666–1680. - PubMed
Publication types
MeSH terms
Substances
Grants and funding
LinkOut - more resources
Full Text Sources
Other Literature Sources
Medical
Molecular Biology Databases
Research Materials
Miscellaneous
