Comparative Study
. 2005 Oct 26;25(43):9836-49.
doi: 10.1523/JNEUROSCI.3497-05.2005.

Alpha7 neuronal nicotinic acetylcholine receptors are negatively regulated by tyrosine phosphorylation and Src-family kinases

Affiliations
Comparative Study

Alpha7 neuronal nicotinic acetylcholine receptors are negatively regulated by tyrosine phosphorylation and Src-family kinases

Eric Charpantier et al. J Neurosci. .

Abstract

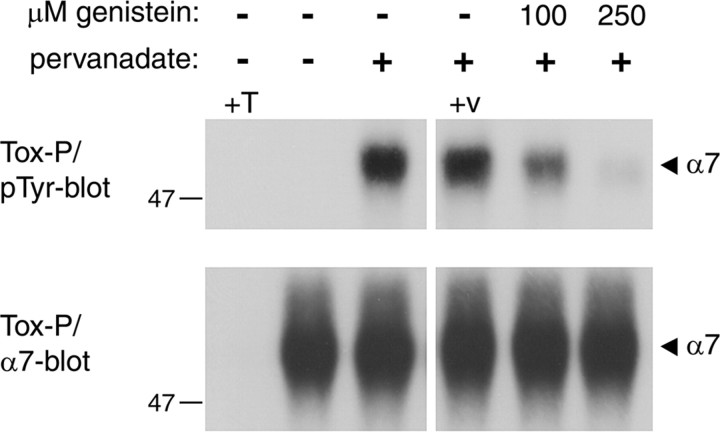
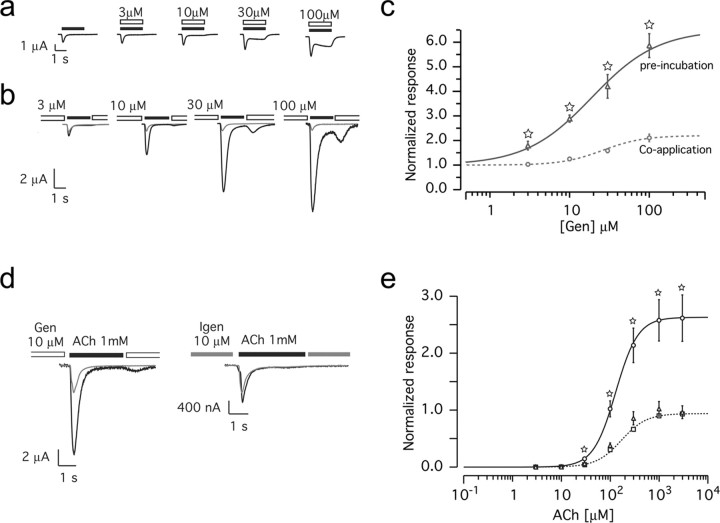
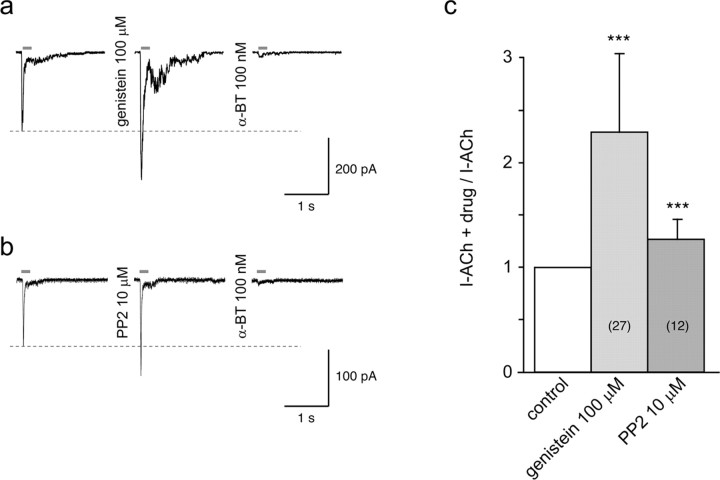
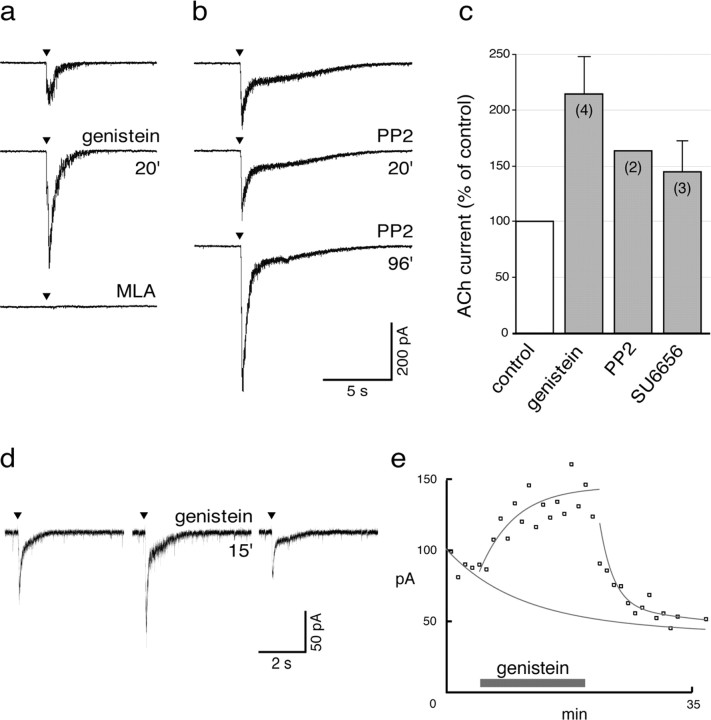
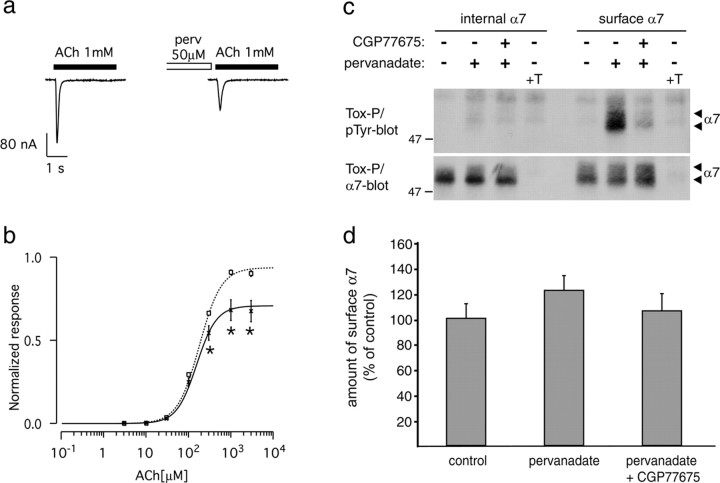
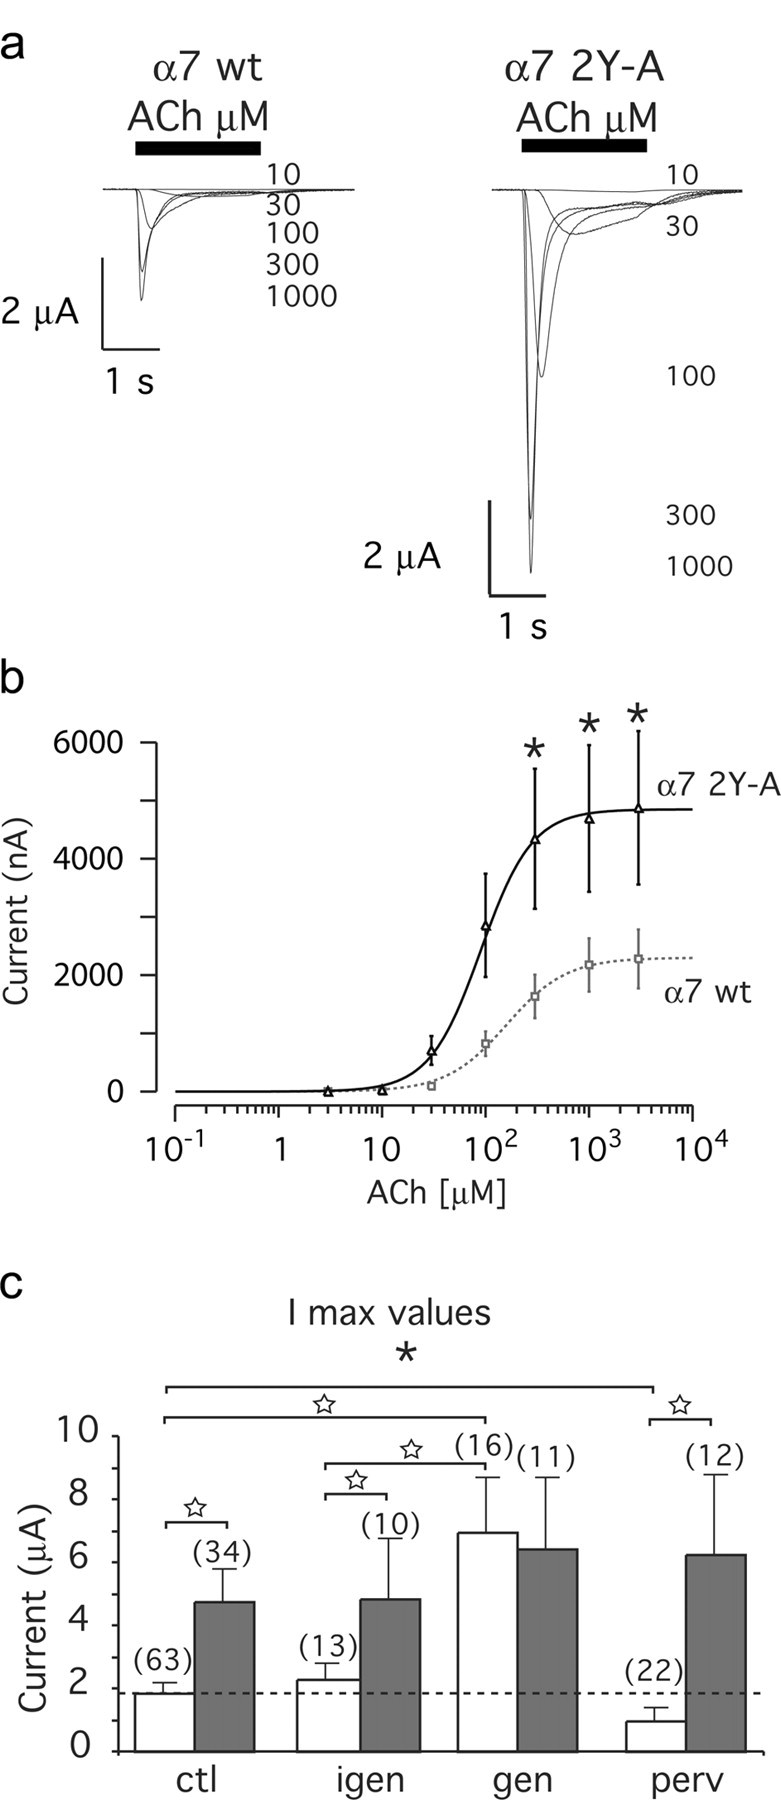
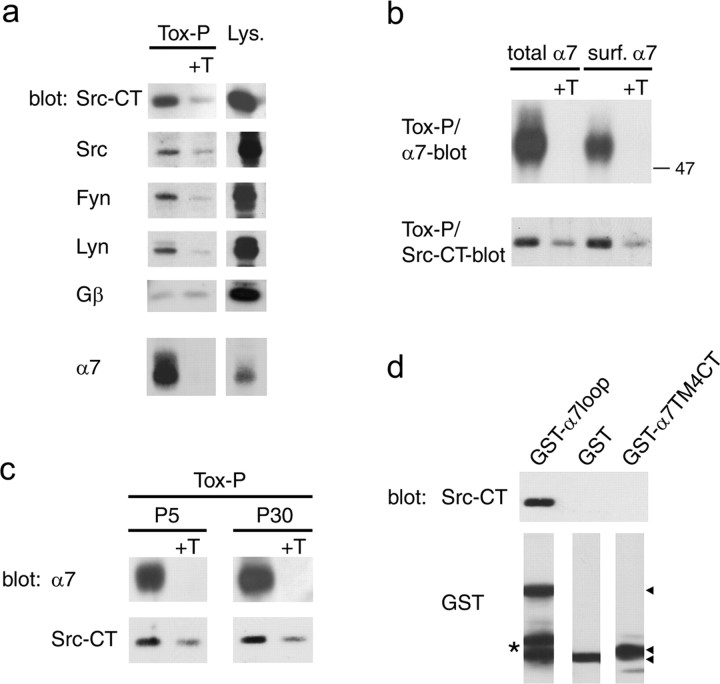
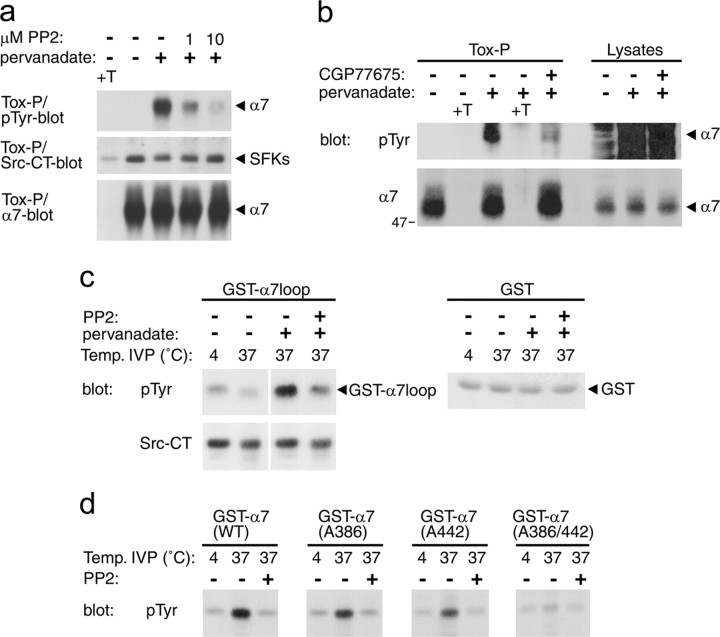
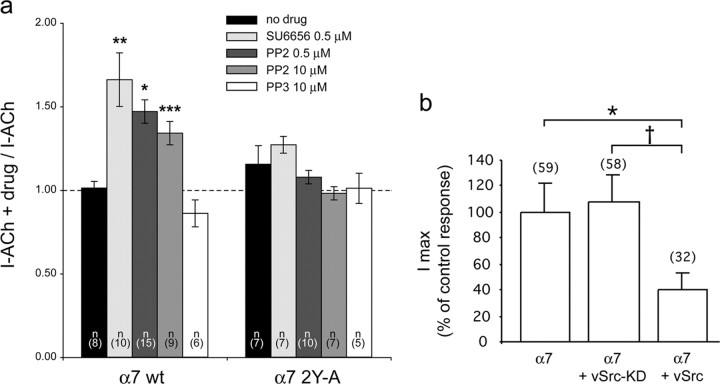
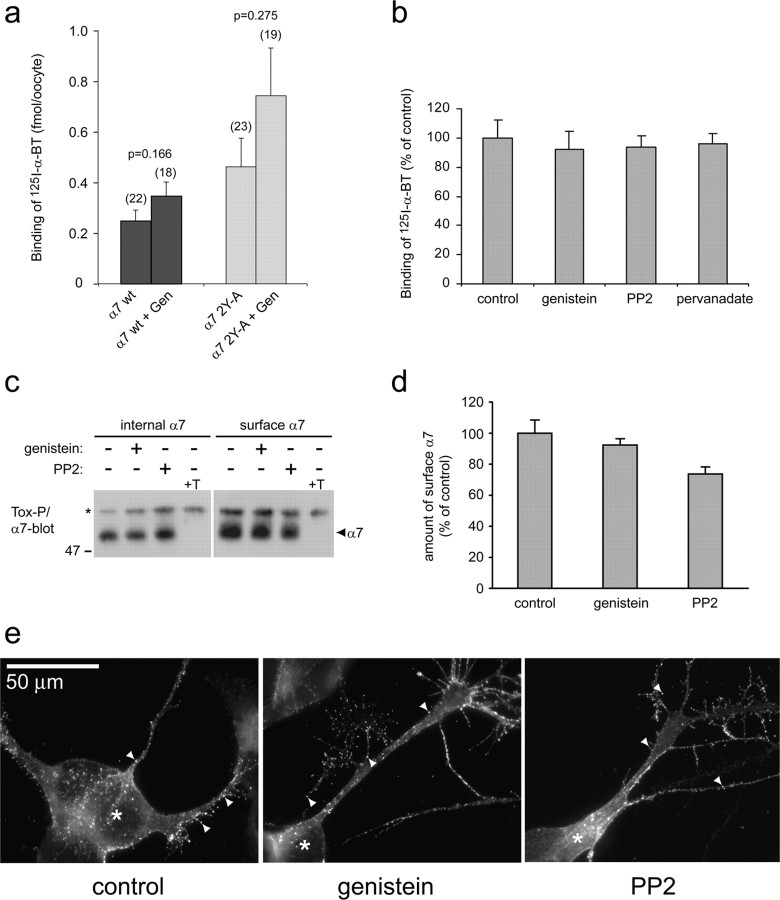
Nicotine, a component of tobacco, is highly addictive but possesses beneficial properties such as cognitive improvements and memory maintenance. Involved in these processes is the neuronal nicotinic acetylcholine receptor (nAChR) alpha7, whose activation triggers depolarization, intracellular signaling cascades, and synaptic plasticity underlying addiction and cognition. It is therefore important to investigate intracellular mechanisms by which a cell regulates alpha7 nAChR activity. We have examined the role of phosphorylation by combining molecular biology, biochemistry, and electrophysiology in SH-SY5Y neuroblastoma cells, Xenopus oocytes, rat hippocampal interneurons, and neurons from the supraoptic nucleus, and we found tyrosine phosphorylation of alpha7 nAChRs. Tyrosine kinase inhibition by genistein decreased alpha7 nAChR phosphorylation but strongly increased acetylcholine-evoked currents, whereas tyrosine phosphatase inhibition by pervanadate produced opposite effects. Src-family kinases (SFKs) directly interacted with the cytoplasmic loop of alpha7 nAChRs and phosphorylated the receptors at the plasma membrane. SFK inhibition by PP2 [4-amino-5-(4-chlorophenyl)-7-(t-butyl)pyrazolo[3,4-d]pyrimidine] or SU6656 (2,3-dihydro-N,N-dimethyl-2-oxo-3-[(4,5,6,7-tetrahydro-1H-indol-2-yl)methylene]-1H-indole-5-sulfonamide) increased alpha7 nAChR-mediated responses, whereas expression of active Src reduced alpha7 nAChR activity. Mutant alpha7 nAChRs lacking cytoplasmic loop tyrosine residues because of alanine replacement of Tyr-386 and Tyr-442 were more active than wild-type receptors and insensitive to kinase or phosphatase inhibition. Because the amount of surface alpha7 receptors was not affected by kinase or phosphatase inhibitors, these data show that functional properties of alpha7 nAChRs depend on the tyrosine phosphorylation status of the receptor and are the result of a balance between SFKs and tyrosine phosphatases. These findings reveal novel regulatory mechanisms that may help to understand nicotinic receptor-dependent plasticity, addiction, and pathology.


Figures

Figure 1.
Figure 1.
Regulation of α7 receptor tyrosine phosphorylation by genistein and pervanadate. SH-α7 cells were treated for 10 min with genistein, followed by addition of 50 μm pervanadate for 20 min in the presence of genistein. In controls, these compounds were omitted or the vehicle alone (0.25% DMSO, +v) was added. Cells were lysed and α7 receptors were precipitated using biotinylated α-BT and streptavidin-agarose (Tox-P). As a control, an excess of free α-BT was added before precipitation (+T). Immunoblotting using phosphotyrosine-specific antibodies, followed by α7 reprobing, reveals that pervanadate causes strong α7 receptor phosphorylation, which is greatly reduced by genistein. Shorter exposure times and side-by-side alignment of blots confirmed precise overlap between phosphotyrosine and α7 signals (data not shown).
Figure 2.
Figure 2.
Genistein potentiates α7 nAChRs in Xenopus oocytes. Oocytes expressing human α7 nAChRs were challenged under two-electrode voltage clamp. a, Recorded current during coapplication of ACh (200 μm, 2 s; filled bars) with increasing concentrations of genistein (open bars). b, ACh-evoked (200 μm, 2 s) current before (gray traces) or after (1-2 h) incubation with increasing concentrations of genistein (black traces). c, Genistein (Gen) dose-response curves obtained from coapplication (a, circles, dashed line) or preincubation (b, triangles, solid line). At each genistein concentration tested, the current enhancement recorded for α7 is much stronger in the case of preincubation than for coapplication. Data are normalized to the ACh-evoked current recorded in absence of genistein (n = 8, for all data points). The EC50 for genistein coapplication is 26 μm and for preincubation is 19 μm. d, Application of ACh (1 mm during 3 s) evoked a current (gray traces) that is enhanced by preincubation with 10 μm genistein (black trace, left) but not with 10 μm Igen (black trace, right). e, ACh dose-response curve. Currents were evoked by successive ACh test pulses (3 s) applied every 90 s, using increasing ACh concentrations. Currents were normalized to 1 at saturating concentration recorded in controls. Squares and dashed line correspond to control (n = 34), circles and solid line were recorded after genistein treatment (10 μm, 1-2 h; n = 16), and triangles correspond to Igen treatment (10 μm, 1-2 h; n = 12). Currents recorded after genistein treatments are significantly different from control, but their EC50 values are not different (supplemental Table 1, available at www.jneurosci.org as supplemental material). For all dose-response curves, data points are mean ± SEM. Lines correspond to the best fit obtained with a Hill equation. Significant differences were calculated by unpaired, two-tailed Student's t tests (p < 0.001).
Figure 3.
Figure 3.
Genistein and PP2 potentiate ACh-evoked currents in SH-α7 cells. a, Currents evoked by brief ACh test pulses (1 mm, 200 ms) were recorded in control conditions (left trace), after 1 min exposure to 100 μm genistein (middle trace), and again after 1 min incubation with 100 nm α-BT (right trace). Bars above the traces indicate the duration of ACh application. Dashed line indicates the amplitude of the peak of the ACh-evoked current measured in control. b, Recordings obtained in another cell using the same protocol but with exposure to PP2 (10 μm). To avoid direct effects of genistein or PP2, cells were washed for 5 s before testing with ACh. All recordings were obtained in whole-cell patch-clamp configuration at a holding potential of -100 mV. c, Ratios between ACh-evoked currents recorded after drug treatment and before drug treatment (control), measured for 27 genistein-treated and 12 PP2-treated cells, are represented. Paired Student's t test computations of the current amplitude recorded after exposure to genistein or PP2 versus the value measured in the same cell in control (before drug treatment) indicate a highly significant increase attributable to both inhibitors (***p < 0.001).
Figure 4.
Figure 4.
Genistein and specific SFK inhibitors potentiate native α7 nAChRs. a-c, Effect of genistein and of specific SFK inhibitors on hippocampal CA1 interneurons. a represents current traces evoked by brief ACh pulses (0.2 mm; see Materials and Methods) in control conditions (top trace), after genistein application (100 μm, 20 min; middle trace), and in the presence of MLA (10 nm; bottom trace). Genistein causes an increase of the ACh peak current, and MLA abolishes the ACh response. b, Current traces, recorded in another hippocampal interneuron and showing the ACh-evoked current in control conditions (top trace) and after application of PP2 (10 μm) for 20 and 96 min (middle and bottom traces, respectively). PP2 had to be applied for a longer time than genistein before observing a significant potentiation. c, Histogram showing the mean effects of genistein (100 μm), PP2 (10 μm), and SU6656 (0.5 μm) on the ACh-evoked current in hippocampal interneurons. Numbers indicate the number of neurons analyzed. d, e, Effect of genistein on the ACh-evoked current in magnocellular supraoptic neurons. d represents the mean current traces (n = 3) evoked by ACh pulses (1 mm) in control conditions (left trace), after genistein application (100 μm, 15 min; middle trace), and after a 10 min recovery (right trace). e, Peak amplitude of ACh-evoked currents (squares) plotted in absolute value as a function of the recording time. Genistein was added to the perfusion solution for the 15 min period represented by the horizontal gray bar. Lines through the data points are exponential best fits. Note that, despite a progressive decrease in the ACh peak current, probably attributable to receptor desensitization and run down, genistein markedly and reversibly increased the ACh response.
Figure 5.
Figure 5.
Pervanadate inhibits human α7 nAChRs in Xenopus oocytes. a, ACh-evoked (1 mm, 3 s) current without (left) or after 0.5-1 h incubation with 50 μm pervanadate (perv, right). b, ACh dose-response curve without (squares, dashedline; n = 28) and after pervanadate treatment (crosses, solid line; n = 22). Currents were evoked by successive test pulses (3 s) with increasing ACh concentrations, applied every 90 s. Currents were normalized to 1 at saturating ACh concentration (no perv). Data points are expressed as mean ± SEM, and the lines correspond to the best fit with a Hill equation (supplemental Table 1, available at www.jneurosci.org as supplemental material). Significant differences between pervanadate and control treatments were calculated by unpaired, two-tailed Student's t tests (*p < 0.01). c, SH-α7 cells were treated for 90 min with 10 μm CGP77675, followed by addition of 50 μm pervanadate. In controls, these compounds were omitted or an excess of free α-BT was added before precipitation (+T). Intracellular or surface α7 receptors were precipitated using biotinylated α-BT and analyzed by phosphotyrosine and α7 immunoblotting. Pervanadate causes phosphorylation of surface but not internal α7 receptors, and this phosphorylation originates from SFKs. Pervanadate, alone or with CGP77675, does not decrease the number of surface α7 receptors or affect internal α7. d, α7 blots as shown in c were quantitated by densitometric scanning (mean ± SD; n = 10).
Figure 6.
Figure 6.
α7 2Y-A mutant nAChRs exhibit larger ACh-evoked currents compared with wild-type α7. Xenopus oocytes expressing wild-type or α7 2Y-A (Y386A, Y442A) receptor were recorded using two-electrode voltage clamp. a, ACh-evoked currents for wild-type and mutant α7 nAChRs. Increasing ACh concentrations are indicated and expressed in micromolar. b, ACh dose-response curves for wild-type α7 (squares, dashed line; n = 63) and mutant α7 2Y-A receptors (triangle, solid line; n = 34). Currents were evoked by successive test pulses (3 s) with increasing ACh concentrations, applied every 90 s. Lines through the data points correspond to the best fit with a Hill equation (supplemental Table 1, available at www.jneurosci.org as supplemental material). c, Maximal recorded currents (Imax) were plotted as a function of the drug applied at wild-type α7 (open bars) or α7 2Y-A mutant receptor (gray bars). Genistein (gen) and genistin (igen) concentrations were 10 μm. The numbers in parentheses indicate the number of cells tested in each condition. Data are expressed as mean ± SEM and show that ACh-evoked currents are higher for α7 2Y-A nAChRs and that these receptors are insensitive to genistein and pervanadate (perv) treatment. Significant differences were calculated by unpaired, two-tailed Student's t tests (*p < 0.01; ★p < 0.001).
Figure 7.
Figure 7.
α7 nAChRs interact with SFKs. a, α7 receptors were precipitated from SH-α7 cells using biotinylated α-BT followed by streptavidin-agarose (Tox-P), and associated proteins were identified by immunoblotting. As controls, excess free α-BT was added before precipitation (+T), or a fraction of the lysate was analyzed without precipitation (Lys.). Pan-Src (Src-CT) and single kinase-specific antibodies show that α7 receptors associate with SFKs, including Src, Fyn, and Lyn, whereas no specific association occurs with the Gβ subunit of trimeric G-proteins. b, Surface or total α7 receptors were precipitated from SH-α7 cells and probed with Src-CT antibodies, showing that the association of α7 nAChRs with SFKs is prominent at the cell surface. c, Whole brains of P5 rats and forebrains of P30 rats were homogenized in NP-40-containing buffer, and α7 receptors were isolated using α-BT coupled to Sepharose beads. Src-CT blotting reveals specific association of α7 nAChRs with SFKs in brain. d, Lysates from SH-α7 cells were incubated with glutathione bead-bound GST-fusion proteins containing either the α7 loop (GST-α7loop) or the fourth transmembrane domain and C-terminal rest (GST-α7 TM4CT). Src-CT blotting of precipitated beads shows that SFKs bind specifically to the α7 loop. Arrowheads indicate the GST fusion proteins, and the asterisk denotes degradation products of GST-α7loop.
Figure 8.
Figure 8.
SFKs phosphorylate tyrosine residues in the α7 loop. a, b, SH-α7 cells were treated for 10 min with PP2 or for 45 min with CGP77675, followed by addition of 50 μm pervanadate for 20 min in the presence of the SFK inhibitors. α-BT-precipitated α7 was analyzed by phosphotyrosine and α7 immunoblotting. Fractions of lysates were analyzed without precipitation in b. Pervanadate-induced phosphorylation of α7 nAChRs is reduced by the SFK inhibitors PP2 or CGP77675, showing that SFKs can phosphorylate α7 receptors within SH-α7 cells. c, SH-α7 cells were treated with PP2 and pervanadate as in a, lysed, and incubated with bead-bound GST-α7loop fusion protein or control GST. After precipitation and washing, bead complexes (containing GST fusions and associated proteins, including SFKs) were subjected to in vitro phosphorylation (IVP) reactions in the presence of ATP at 4°C or 37°C. Bead complexes were analyzed by phosphotyrosine and Src-CT immunoblotting, showing that pervanadate-activated SH-α7 cell lysates phosphorylate GST-α7loop proteins and that this phosphorylation originates from SFKs. d, Purified GST-fusion proteins containing the α7 wild-type loop or mutants in which Tyr-386 and/or Tyr-442 are replaced by alanine were incubated with purified human Src kinase. In vitro phosphorylation was assessed in the presence of ATP at 4°C or 37°C, with or without PP2. Phosphotyrosine blotting of reaction products shows that Src phosphorylates both tyrosines in the α7 loop.
Figure 9.
Figure 9.
SFKs regulate α7 nAChR responses. a, SFK-inhibitors SU6656 and PP2 increase the ACh-evoked currents in wild-type but not mutant α7 nAChRs. ACh-evoked currents were recorded in Xenopus oocytes expressing either wild-type human α7(α7 wt) or the human α7-2YA mutant receptor before and after 1 h incubation with the indicated kinase inhibitor. Ratios between currents recorded after drug treatment and before treatment, measured in a series of cells from two oocyte batches, are represented. n represents the number of cells tested in each condition. Asterisks indicate statistically significant results (compared with no drug control), and error bars correspond to SEM (*p = 0.007; **p = 0.002; ***p = 0.001, by Student's t tests, using two samples with unequal variance and two-tail distribution). b, DNA expression vectors encoding vSrc or viral Src kinase without phosphorylation activity (vSrc-KD) were coinjected with human α7 nAChR vector in Xenopus oocytes. Imax, evoked by 1 mm ACh during 2 s, is reduced by more than 50% when vSrc is present compared with Imax in control, but no effect is observed when vSrc-KD is coexpressed. Data are expressed as mean ± SEM. The number of cells tested is indicated in parentheses. Significant differences were calculated by unpaired, two-tailed Student's t tests (*p < 0.01; †p < 0.05).
Figure 10.
Figure 10.
Kinase or phosphatase inhibition does not change the amount and clustering of α7 receptors at the cell surface. a, Oocytes expressing α7 wild-type (wt) or the α7 2Y-A mutant receptor were incubated in control conditions or with 10 μm genistein (Gen) and labeled with 10 nm 125I-α-BT for 1 h. Cells were washed, and bound toxin was determined by gamma counting. Nonspecific binding was assessed by addition of 1 μm unlabeled α-BT and subtracted. Numbers in parentheses indicate the number of cells for calculation of mean ± SEM. Genistein does not affect the number of surface receptors significantly (p values determined by Student's t tests), and the slight increase between wild-type and α7 2Y-A receptors is not significant either. b, SH-α7 cells were treated with 100 μm genistein, 10 μm PP2, or 50 μm pervanadate and labeled with 10 nm 125I-α-BT for 1 h. Washed cells were lysed, and radioactivity was quantitated by gamma counting. Nonspecific binding was assessed by adding 1 μm unlabeled α-BT and subtracted. Inhibitors do not affect levels of surface α7 receptors (mean ± SD; 4 experiments). c, d, SH-α7 cells were incubated with 100 μm genistein or 10 μm PP2, and surface or internal receptors were precipitated with biotin-α-BT (Tox-P) as detailed in Materials and Methods. α7 immunoblotting (c) and quantitation of blots from three experiments by densitometric scanning (d) reveal no increase in the amount of surface receptors attributable to genistein or PP2. +T, Addition of 10 μm free α-BT to cell lysates abolishes the α7 signal. e, SH-α7 cells were incubated with Alexa 488-coupled α-BT to stain surface α7 receptors. Fluorescence microscopy identifies many small (∼1 μm) α7 clusters on soma and cellular processes (arrowheads). Soma (asterisks) were identified by DAPI nuclear staining (data not shown). Genistein (100 μm) or PP2 (10 μm) treatment does not affect number, size, intensity, or distribution of clusters.

Similar articles

Cited by

References

    1. Akiyama T, Ishida J, Nakagawa S, Ogawara H, Watanabe S, Itoh N, Shibuya M, Fukami Y (1987) Genistein, a specific inhibitor of tyrosine-specific protein kinases. J Biol Chem 262: 5592-5595. - PubMed
    1. Alkondon M, Reinhardt S, Lobron C, Hermsen B, Maelicke A, Albuquerque EX (1994) Diversity of nicotinic acetylcholine receptors in rat hippocampal neurons. II. The rundown and inward rectification of agonistelicited whole-cell currents and identification of receptor subunits by in situ hybridization. J Pharmacol Exp Ther 271: 494-506. - PubMed
    1. Alkondon M, Pereira EF, Barbosa CT, Albuquerque EX (1997) Neuronal nicotinic acetylcholine receptor activation modulates gammaaminobutyric acid release from CA1 neurons of rat hippocampal slices. J Pharmacol Exp Ther 283: 1396-1411. - PubMed
    1. Alkondon M, Pereira EF, Albuquerque EX (1998) Alpha-bungarotoxin- and methyllycaconitine-sensitive nicotinic receptors mediate fast synaptic transmission in interneurons of rat hippocampal slices. Brain Res 810: 257-263. - PubMed
    1. Balduzzi R, Cupello A, Robello M (2002) Modulation of the expression of GABA(A) receptors in rat cerebellar granule cells by protein tyrosine kinases and protein kinase C. Biochim Biophys Acta 1564: 263-270. - PubMed

Publication types

MeSH terms