Comparative Study
. 2005 Oct 26;25(43):9919-31.
doi: 10.1523/JNEUROSCI.1874-05.2005.

Neural correlates of reach errors

Affiliations
Comparative Study

Neural correlates of reach errors

Jörn Diedrichsen et al. J Neurosci. .

Abstract

Reach errors may be broadly classified into errors arising from unpredictable changes in target location, called target errors, and errors arising from miscalibration of internal models (e.g., when prisms alter visual feedback or a force field alters limb dynamics), called execution errors. Execution errors may be caused by miscalibration of dynamics (e.g., when a force field alters limb dynamics) or by miscalibration of kinematics (e.g., when prisms alter visual feedback). Although all types of errors lead to similar on-line corrections, we found that the motor system showed strong trial-by-trial adaptation in response to random execution errors but not in response to random target errors. We used functional magnetic resonance imaging and a compatible robot to study brain regions involved in processing each kind of error. Both kinematic and dynamic execution errors activated regions along the central and the postcentral sulci and in lobules V, VI, and VIII of the cerebellum, making these areas possible sites of plastic changes in internal models for reaching. Only activity related to kinematic errors extended into parietal area 5. These results are inconsistent with the idea that kinematics and dynamics of reaching are computed in separate neural entities. In contrast, only target errors caused increased activity in the striatum and the posterior superior parietal lobule. The cerebellum and motor cortex were as strongly activated as with execution errors. These findings indicate a neural and behavioral dissociation between errors that lead to switching of behavioral goals and errors that lead to adaptation of internal models of limb dynamics and kinematics.


Figures

Figure 1.
Figure 1.
Experimental setup for imaging experiments. A, Participant, for better visibility shown outside the scanner, holds on to a robotic arm and makes 4 cm movements in the horizontal plane (white arrow). B, Visual feedback as viewed by the participant on a back-projection screen. A movement away from the head corresponded to an upward cursor movement. Only the current target and cursor are present on the screen. Dotted target locations indicate the rest position and possible target locations in the target-jump condition.
Figure 2.
Figure 2.
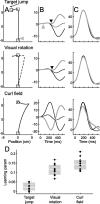
Results of the behavioral experiment. A, Average hand position trace (solid line) and cursor position trace (dashed line) in the target-jump, visual-rotation, and curl-field conditions. All movements start at the lower box. The gray triangle indicates average position and time of target jump. Hand velocities (in centimeters per second) in the lateral direction (B) and in the forward direction (C) for trials perturbed to the left (black line), to the right (gray line), and unperturbed trials (dashed line). The black triangle marks the average onset of the correction. D, Trial-to-trial adaptation rater estimated from the state-space model (Eq. 1; see Materials and Methods). The dots plot the estimates for individual participants.
Figure 3.
Figure 3.
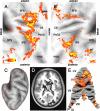
Population-averaged activity related to normal reaching movements compared with rest on a flattened representation of the left (A) and right (B) cortical hemisphere is shown. The lateral and parts of the medial surface of parietal and frontal lobe are shown: grayscale indicates sulcucal depth with sulci shown in dark gray, averaged across participants. SFS, Superior frontal sulcus; CS, central sulcus; PoCS, postcentral sulcus; IPS, intraparietal sulcus; STS, superior temporal sulcus; POS, parieto-occipital sulcus; MT, middle temporal area. C, Sulci (black lines) and the border of the flattened representation (red line) on an inflated representation of the left hemisphere. Average movement-related activity in basal ganglia and thalamus (D) and on a flattened representation of the cerebellum (E) is shown. Roman numerals denote cerebellar lobules according to the Larsell notation (Schmahmann et al., 2000). All maps are thresholded at t(13) > 3.61.
Figure 4.
Figure 4.
Averaged activity in the visual control condition 2 versus rest on a flat representation of the left (A) and right (B) cortical hemispheres is shown. Threshold is t(13) > 3.61. FEF, Human frontal eye field. Other abbreviations as in Figure 3.
Figure 5.
Figure 5.
Statistical t map of areas activated more attributable to execution errors that lead to adaptation of internal models (blue) or more attributable to target errors that arise from a change in the reach target (red). Shown is the interaction contrast of Equation 5 at a threshold of t(13) > 3.61. Bar graphs with the percentage signal change relative to rest from significant cluster are shown on the margins. Abbreviations as in Figure 3
Figure 6.
Figure 6.
Interaction contrast (Eq. 5) for the subcortex. A, Left (p = 0.031) and right (p < 0.001) striatum show a stronger response to goal errors than to execution errors. B, No significant sites were found in the cerebellum (see Results). C, Activation in anatomically defined ROIs. Results for symmetric left and right ROIs are shown next to each other. The middle bars show the proportion of each ROI that was identified as task related (average movement > rest; p < 0.05 uncorrected). The bar graphs show percentage signal change averaged only over task-related voxel for normal movement (N), visual-rotation (VR), target-jump (TJ), visual control 1 (C1), and visual control 2 (C2) conditions.
Figure 7.
Figure 7.
Activation in experiment 2 in the visual-rotation (blue) and curl-field (red) conditions relative to normal movements at a threshold of t(16) > 4 for the left (A) and right (B) hemisphere is shown. Purple areas indicate overlap. The bar graphs show average percentage signal change in selected areas of the left hemisphere for normal (N), visual-rotation (VR), curl-field (CF), and resistive-field (RF) conditions. Abbreviations as in Figure 3
Figure 8.
Figure 8.
A, Activation in experiment 2 in the visual-rotation (blue) and curl-field (red) conditions relative to normal movements at a threshold of t(16) > 4 displayed on a surface representation of the cerebellum (Van Essen, 2002). B, Percentage signal change (dark bars) in subcortical ROIs during normal (N), visual-rotation(VR), curl-field (CF), and resistive field (RF) conditions. The middle gray bars show the proportion of each ROI that was identified as movement related (average movement > rest; p < 0.05 uncorrected).

References

    1. Ashburner J, Friston KJ (1999) Nonlinear spatial normalization using basis functions. Hum Brain Mapp 7: 254-266. - PMC - PubMed
    1. Astafiev SV, Shulman GL, Stanley CM, Snyder AZ, Van Essen DC, Corbetta M (2003) Functional organization of human intraparietal and frontal cortex for attending, looking, and pointing. J Neurosci 23: 4689-4699. - PMC - PubMed
    1. Atkeson CG (1989) Learning arm kinematics and dynamics. Annu Rev Neurosci 12: 157-183. - PubMed
    1. Baizer JS, Kralj-Hans I, Glickstein M (1999) Cerebellar lesions and prism adaptation in macaque monkeys. J Neurophysiol 81: 1960-1965. - PubMed
    1. Battaglia-Mayer A, Ferraina S, Mitsuda T, Marconi B, Genovesio A, Onorati P, Lacquaniti F, Caminiti R (2000) Early coding of reaching in the parietooccipital cortex. J Neurophysiol 83: 2374-2391. - PubMed

Publication types

MeSH terms

LinkOut - more resources