Comparative Study
. 2005 Oct 26;25(43):10041-8.
doi: 10.1523/JNEUROSCI.2588-05.2005.

In vivo magnetic resonance microimaging of individual amyloid plaques in Alzheimer's transgenic mice

Affiliations
Comparative Study

In vivo magnetic resonance microimaging of individual amyloid plaques in Alzheimer's transgenic mice

Clifford R Jack Jr et al. J Neurosci. .

Abstract

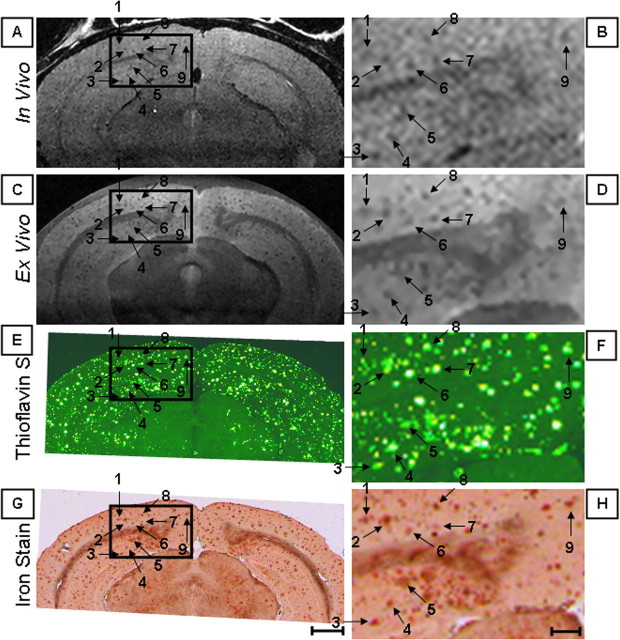
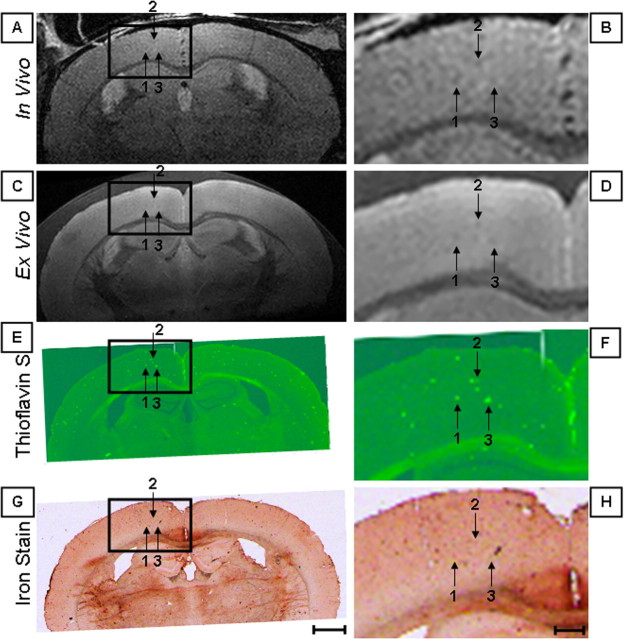
The ability to detect individual Alzheimer's amyloid plaques in vivo by magnetic resonance microimaging (MRI) should improve diagnosis and also accelerate discovery of effective therapeutic agents for Alzheimer's disease (AD). Here, we perform in vivo and ex vivo MRI on double transgenic AD mice as well as wild-type mice at varying ages and correlate these with thioflavin-S and iron staining histology. Quantitative counts of individual plaques on MRI increase with age and correlate with histologically determined plaque burden. Plaques 20 microm in diameter can be detected in AD mice as young as 3 months of age with ex vivo MRI. Plaques 35 microm in diameter can be detected by 9 months of age with in vivo MRI. In vivo MRI of individual Alzheimer's amyloid plaques provides a noninvasive estimate of plaque burden in transgenic AD mice that might be useful in assessing the efficacy of amyloid reduction therapies.


Figures

Figure 1.
Figure 1.
ROIs used for plaque counting. See Materials and Methods for details. Scale bar, 500 μm.
Figure 2.
Figure 2.
Twenty-four-month-old AD mouse. In vivo MRI (A, B), ex vivo MRI (C, D), Thio-S-stained (E, F), and iron-stained (G, H) images have been precisely spatially registered over a circumscribed area of the cortex, indicated by the box. The boxes in the right column (scale bar, 100 μm) represent 3× magnified portions of the adjacent parent image in the left column (scale bar, 1.0 mm). The numbered arrows indicate individual plaques visualized in each of the four different image types that matched with the linked cursor system.
Figure 3.
Figure 3.
Twelve-month-old AD mouse. In vivo MRI (A, B), ex vivo MRI (C, D), Thio-S-stained (E, F), and iron-stained (G, H) images have been precisely spatially registered over a circumscribed area of the cortex, indicated by the box. The boxes in the right column (scale bar, 100 μm) represent 3 × magnified portions of the adjacent parent image in the left column (scale bar, 1.0 mm). The numbered arrows indicate individual plaques visualized in each of the four different image types that matched with the linked cursor system.
Figure 4.
Figure 4.
Nine-month-old AD mouse. In vivo MRI (A, B), ex vivo MRI (C, D), Thio-S-stained (E, F), and iron-stained (G, H) images have been precisely spatially registered over a circumscribed area of the cortex, indicated by the box. The boxes in the right column (scale bar, 100 μm) represent 3× magnified portions of the adjacent parent image in the left column (scale bar, 1.0 mm). The numbered arrows indicate individual plaques visualized in each of the four different image types that matched with the linked cursor system.
Figure 5.
Figure 5.
Six-month-old AD mouse. In vivo MRI (A, B), ex vivo MRI (C, D), Thio-S-stained (E, F), and iron-stained (G, H) images have been precisely spatially registered over a circumscribed area of the cortex, indicated by the box. The boxes in the right column (scale bar, 100 μm) represent 3× magnified portions of the adjacent parent image in the left column (scale bar, 1.0 mm). The numbered arrows indicate individual plaques visualized in each of the four different image types that matched with the linked cursor system.
Figure 6.
Figure 6.
Three-month-old AD mouse. In vivo MRI (A, B), ex vivo MRI (C, D), Thio-S-stained (E, F), and iron-stained (G, H) images have been precisely spatially registered over a circumscribed area of the cortex, indicated by the box. The boxes in the right column (scale bar, 100 μm) represent 3× magnified portions of the adjacent parent image in the left column (scale bar, 1.0 mm). The numbered arrows indicate individual plaques visualized in each of the four different image types that matched with the linked cursor system.
Figure 7.
Figure 7.
Nine-month-old wild-type mouse. In vivo MRI (A, B), ex vivo MRI (C, D), Thio-S-stained (E, F), and iron-stained (G, H) images have been spatially registered using anatomic landmarks. The boxes in the right column (scale bar, 100 μm) represent 3× magnified portions of the adjacent parent image in the left column (scale bar, 1.0 mm). Note that no plaques are visible on Thio-S or iron stains, and none are evident on the MR images.
Figure 8.
Figure 8.
Mean number of plaques per ROI. MRI versus Thio-S in AD mice aged 3, 6, 9, 12, and 24 months.
Figure 9.
Figure 9.
Diameter of plaques visible on in vivo (A) and ex vivo (B) MRI by age. The ordinate plots the maximum (filled triangle), minimum (filled square), median (filled circle), 25th percentile (long dash), and 75th percentile (short dash) of the plaque diameter in micrometers measured in the corresponding Thio-S-stained histological sections. The values of each maximum, minimum, and median are noted next to each symbol. The abscissa plots the age of the APP/PS1 mice in months. The number of plaques measured for each mouse is noted above the abscissa.

References

    1. Bacskai BJ, Hickey GA, Skoch J, Kajdasz ST, Wang Y, Huang GF, Mathis CA, Klunk WE, Hyman BT (2003) Four-dimensional multiphoton imaging of brain entry, amyloid binding, and clearance of an amyloid-beta ligand in transgenic mice. Proc Natl Acad Sci USA 100: 12462-12467. - PMC - PubMed
    1. Beneviste H, Einstein G, Kim KR, Hulette C, Johnson GA (1999) Detection of neuritic plaques in Alzheimer's disease by magnetic resonance microscopy. Proc Natl Acad Sci USA 96: 14079-14084. - PMC - PubMed
    1. Dhenain M, Privat N, Duyckaerts C, Jacobs RE (2002) Senile plaques do not induce susceptibility effects in T2*-weighted MR microscopic images. NMR Biomed 15: 197-203. - PubMed
    1. Hardy J, Selkoe DJ (2002) The amyloid hypothesis of Alzheimer's disease: progress and problems on the road to therapeutics. Science 297: 353-356. - PubMed
    1. Helpern JA, Lee S-P, Falangola MF, Dyakin V, Bogart A, Ardekani B, Duff K, Branch C, Wisniewski T, de Leon MJ, Wolf O, O'Shea J, Nixon RA (2004) MRI assessment of neuropathology in a transgenic mouse model of Alzheimer's disease. Magn Reson Med 51: 794-798. - PubMed

Publication types