Comparative Study
. 2005 Nov;15(11):1468-76.
doi: 10.1101/gr.4398405.

Measures of human population structure show heterogeneity among genomic regions

Affiliations
Comparative Study

Measures of human population structure show heterogeneity among genomic regions

Bruce S Weir et al. Genome Res. 2005 Nov.

Abstract

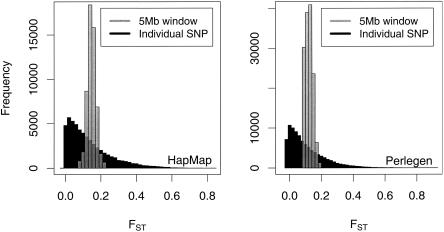
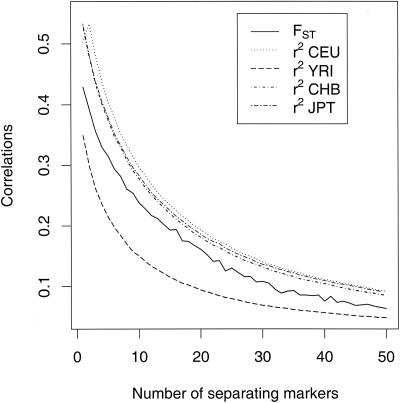
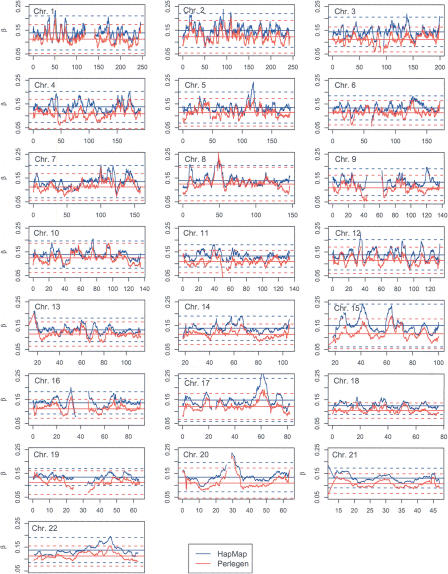
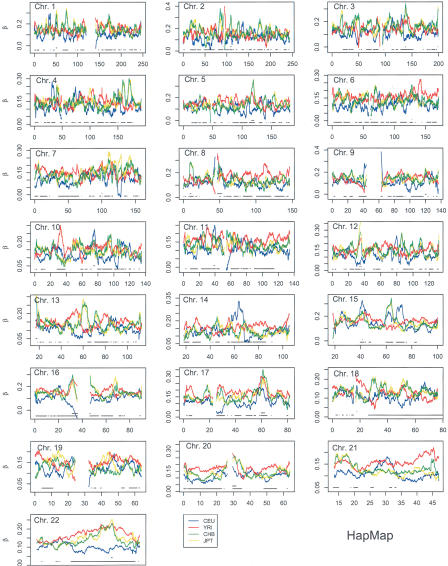
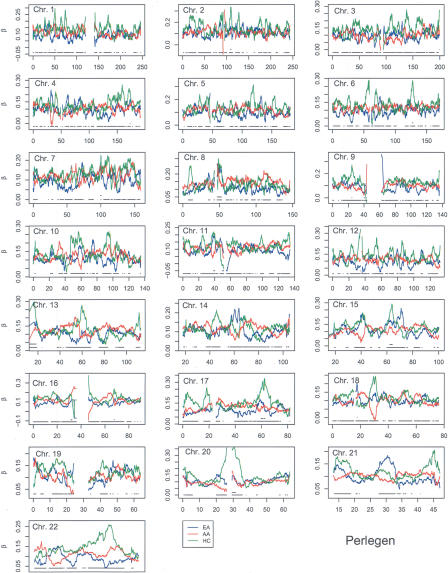
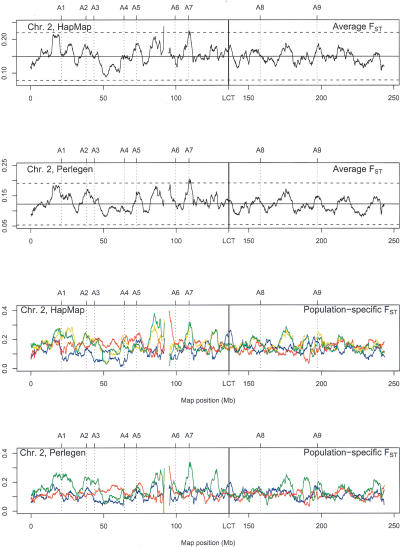
Estimates of genetic population structure (F(ST)) were constructed from all autosomes in two large SNP data sets. The Perlegen data set contains genotypes on approximately 1 million SNPs segregating in all three samples of Americans of African, Asian, and European descent; and the Phase I HapMap data set contains genotypes on approximately 0.6 million SNPs segregating in all four samples from specific Caucasian, Chinese, Japanese, and Yoruba populations. Substantial heterogeneity of F(ST) values was found between segments within chromosomes, although there was similarity between the two data sets. There was also substantial heterogeneity among population-specific F(ST) values, with the relative sizes of these values often changing along each chromosome. Population-structure estimates are often used as indicators of natural selection, but the analyses presented here show that individual-marker estimates are too variable to be useful. There is inherent variation in these statistics because of variation in genealogy even among neutral loci, and values at pairs of loci are correlated to an extent that reflects the linkage disequilibrium between them. Furthermore, it may be that the best indications of selection will come from population-specific F(ST) values rather than the usually reported population-average values.


Figures

Figure 1.
Figure 1.
Histograms of single-locus and 5-Mb window values of FST over the human genome.
Figure 2.
Figure 2.
Correlations for all pairs of markers on chromosome 2 in the HapMap data. Each correlation is calculated for pairs of markers separated by a fixed number of markers (1 to 50). The FST correlations are between the population-average FST values calculated separately for each marker in the pair. The r2 values (i.e., squared correlations) are for each pair of markers in each of the four HapMap samples.
Figure 3.
Figure 3.
5-Mb window population-average FST values for HapMap (blue) and Perlegen (red) samples. (Horizontal solid lines) Chromosome mean values, (horizontal dotted lines) the chromosome means plus or minus three standard deviations.
Figure 4.
Figure 4.
HapMap 5-Mb window population-specific FST values. (Lower broken line) Regions where the greatest difference between population-specific values was more than three standard deviations, (upper broken line) regions where population-average values were more than three standard deviations from the mean.
Figure 5.
Figure 5.
Perlegen 5-Mb window population-specific FST values. (Lower broken line) Regions where the greatest difference between population-specific values was more than three standard deviations, (upper broken line) regions where population-average values were more than three standard deviations from the mean.
Figure 6.
Figure 6.
Human chromosome 2 values of FST from HapMap and Perlegen data. For population-specific values, the HapMap populations are CEU (blue), YRI (red), CHB (green), and JPT (yellow). The Perlegen populations are EA (blue), AA (red), and HC (green). The genes A1–A9 are: A1: APOB; A2: FAM82A (formerly LOC151393); A3: THADA (formerly FLJ21877); A4: PELI1; A5: SEC15L2 (formerly SEC15B); A6: REVIL; A7: EDAR; A8: GALNT5; A9: HECW2 (formerly KIAA1301) as described in Supplemental Table A of Akey et al. (2002).

References

    1. Akey, J.M., Zhang, G., Zhang, K., Jin, L., and Shriver, M.D. 2002. Interrogating a high-density SNP map for signatures of natural selection. Genome Res. 12: 1805–1814. - PMC - PubMed
    1. Akey, J.M., Eberle, M.A., Rieder, M.J., Carlson, C.S., Shriver, M.D., Nickerson, D.A., and Kruglyak, L. 2004. Population history and natural selection shape patterns of genetic variation in 132 genes. PLoS Biol. 2: 1591–1599. - PMC - PubMed
    1. Bersaglieri, T., Sabeti, P.C., Patterson, N., Vanderploeg, T., Schaffner, S.E., Drake, J.A., Rhodes, M., Reich, D.E., and Hirschhorn, J.N. 2004. Genetic signatures of strong recent positive selection at the lactase gene. Am. J. Hum. Genet. 74: 1111–1120. - PMC - PubMed
    1. Cockerham, C.C. and Weir, B.S. 1983. Variance of actual inbreeding. Theor. Popul. Biol. 23: 85–109. - PubMed
    1. Dodds, K.G. 1986. “Resampling methods in genetics and the effect of family structure in genetic data.” Ph.D. thesis, North Carolina State University, Raleigh.

Publication types

LinkOut - more resources