

Sequence features in regions of weak and strong linkage disequilibrium
- PMID: 16251462
- PMCID: PMC1310640
- DOI: 10.1101/gr.4421405
Sequence features in regions of weak and strong linkage disequilibrium
Abstract
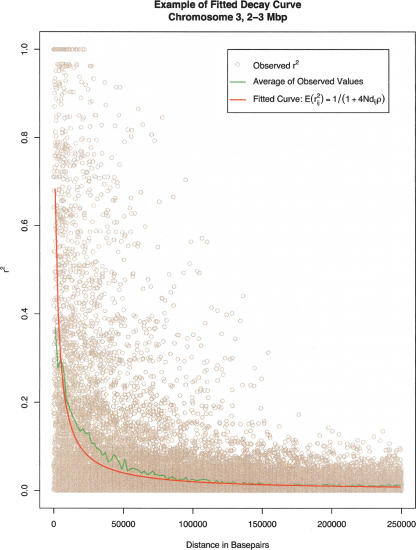
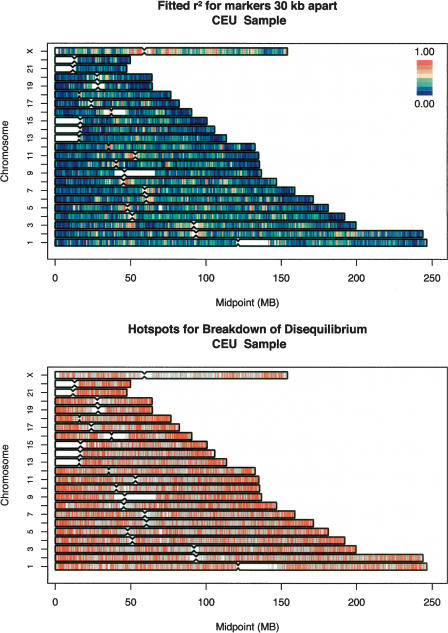
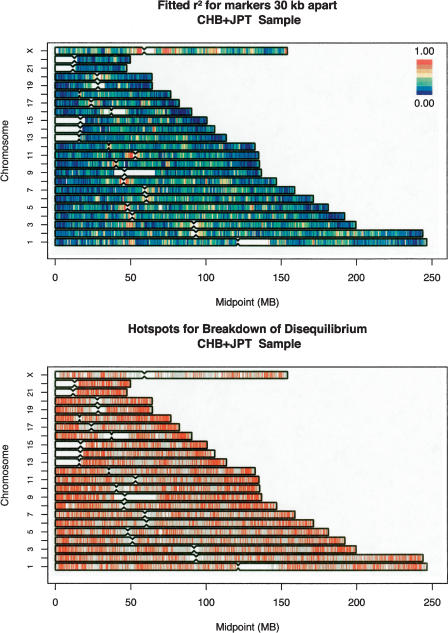
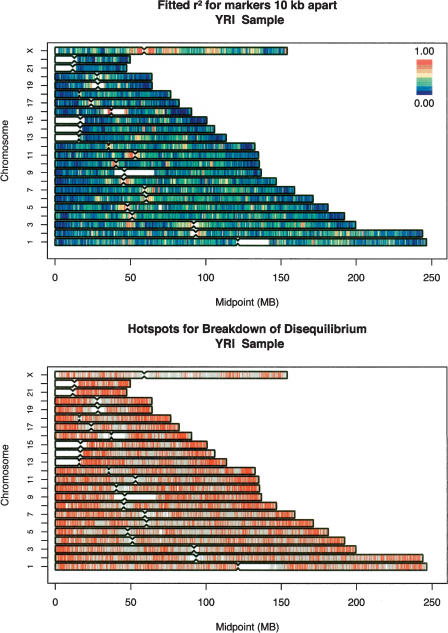
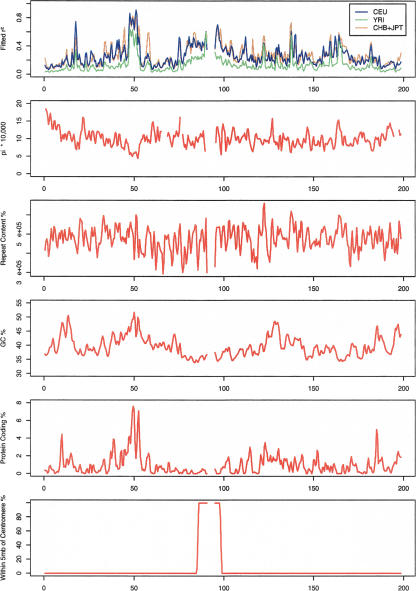
We use genotype data generated by the International HapMap Project to dissect the relationship between sequence features and the degree of linkage disequilibrium in the genome. We show that variation in linkage disequilibrium is broadly similar across populations and examine sequence landscape in regions of strong and weak disequilibrium. Linkage disequilibrium is generally low within approximately 15 Mb of the telomeres of each chromosome and noticeably elevated in large, duplicated regions of the genome as well as within approximately 5 Mb of centromeres and other heterochromatic regions. At a broad scale (100-1000 kb resolution), our results show that regions of strong linkage disequilibrium are typically GC poor and have reduced polymorphism. In addition, these regions are enriched for LINE repeats, but have fewer SINE, DNA, and simple repeats than the rest of the genome. At a fine scale, we examine the sequence composition of "hotspots" for the rapid breakdown of linkage disequilibrium and show that they are enriched in SINEs, in simple repeats, and in sequences that are conserved between species. Regions of high and low linkage disequilibrium (the top and bottom quartiles of the genome) have a higher density of genes and coding bases than the rest of the genome. Closer examination of the data shows that whereas some types of genes (including genes involved in immune response and sensory perception) are typically located in regions of low linkage disequilibrium, other genes (including those involved in DNA and RNA metabolism, response to DNA damage, and the cell cycle) are preferentially located in regions of strong linkage disequilibrium. Our results provide a detailed analysis of the relationship between sequence features and linkage disequilibrium and suggest an evolutionary justification for the heterogeneity in linkage disequilibrium in the genome.
Figures
Similar articles
-
Complex high-resolution linkage disequilibrium and haplotype patterns of single-nucleotide polymorphisms in 2.5 Mb of sequence on human chromosome 21.Genomics. 2001 Nov;78(1-2):64-72. doi: 10.1006/geno.2001.6646. Genomics. 2001. PMID: 11707074
-
Linkage disequilibrium of evolutionarily conserved regions in the human genome.BMC Genomics. 2006 Dec 28;7:326. doi: 10.1186/1471-2164-7-326. BMC Genomics. 2006. PMID: 17192199 Free PMC article.
-
Increased gene coverage and Alu frequency in large linkage disequilibrium blocks of the human genome.Genet Mol Res. 2007 Dec 11;6(4):1131-41. Genet Mol Res. 2007. PMID: 18273807
-
Corn and humans: recombination and linkage disequilibrium in two genomes of similar size.Trends Genet. 2004 Feb;20(2):103-11. doi: 10.1016/j.tig.2003.12.002. Trends Genet. 2004. PMID: 14746992 Review.
-
[Linkage disequilibrium in the human genome and its exploitation].Arch Inst Pasteur Tunis. 2005;82(1-4):9-21. Arch Inst Pasteur Tunis. 2005. PMID: 16929750 Review. French.
Cited by
-
A simple method for analyzing exome sequencing data shows distinct levels of nonsynonymous variation for human immune and nervous system genes.PLoS One. 2012;7(6):e38087. doi: 10.1371/journal.pone.0038087. Epub 2012 Jun 6. PLoS One. 2012. PMID: 22701602 Free PMC article.
-
Linkage disequilibrium mapping in domestic dog breeds narrows the progressive rod-cone degeneration interval and identifies ancestral disease-transmitting chromosome.Genomics. 2006 Nov;88(5):541-50. doi: 10.1016/j.ygeno.2006.05.013. Epub 2006 Jul 20. Genomics. 2006. PMID: 16859891 Free PMC article.
-
Single Nucleotide Polymorphism (SNP) Detection and Genotype Calling from Massively Parallel Sequencing (MPS) Data.Stat Biosci. 2013 May;5(1):3-25. doi: 10.1007/s12561-012-9067-4. Stat Biosci. 2013. PMID: 24489615 Free PMC article.
-
The heterogeneous levels of linkage disequilibrium in white spruce genes and comparative analysis with other conifers.Heredity (Edinb). 2012 Mar;108(3):273-84. doi: 10.1038/hdy.2011.72. Epub 2011 Sep 7. Heredity (Edinb). 2012. PMID: 21897435 Free PMC article.
-
Functional and evolutionary correlates of gene constellations in the Drosophila melanogaster genome that deviate from the stereotypical gene architecture.BMC Genomics. 2010 May 24;11:322. doi: 10.1186/1471-2164-11-322. BMC Genomics. 2010. PMID: 20497561 Free PMC article.
References
-
- Abecasis, G.R., Ghosh, D., and Nichols, T.E. 2005. Linkage disequilibrium: Ancient history drives the new genetics. Hum. Hered. 59: 118–124. - PubMed
-
- Begun, D.J. and Aquadro, C.F. 1992. Levels of naturally occurring DNA polymorphism correlate with recombination rates in D. melanogaster. Nature 356: 519–520. - PubMed
Web site references
-
- http://genome.ucsc.edu/cgi-bin/hgTables; UCSC Table Browser.
-
- http://hapmap.cshl.org/; HapMap Project Web site. - PMC - PubMed
-
- http://www.repeatmasker.org; RepeatMasker, A.F.A. Smit and P. Green, unpubl.
Publication types
MeSH terms
Grants and funding
LinkOut - more resources
Full Text Sources
Research Materials
Miscellaneous