Comparative Study
. 2005 Nov;15(11):1547-52.
doi: 10.1101/gr.4211905.

Large-scale recombination rate patterns are conserved among human populations

Affiliations
Comparative Study

Large-scale recombination rate patterns are conserved among human populations

David Serre et al. Genome Res. 2005 Nov.

Abstract

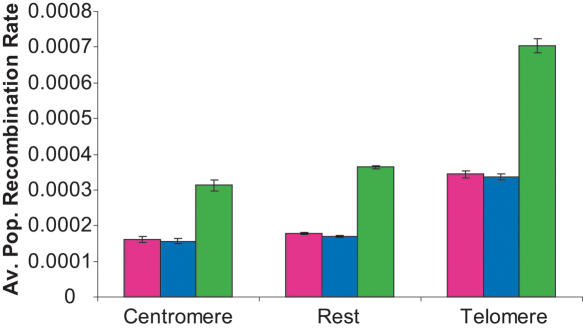
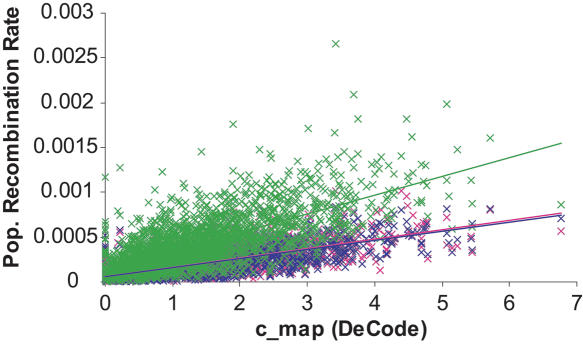
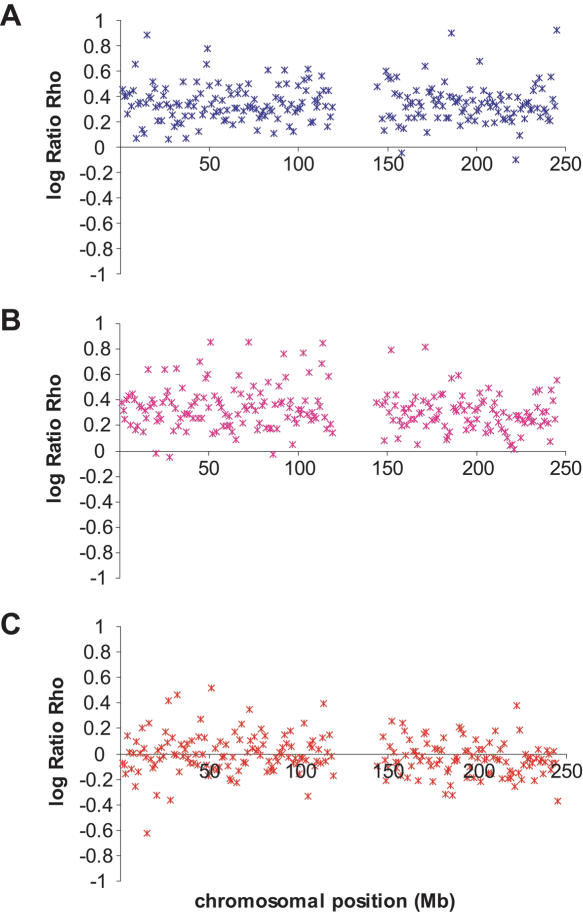
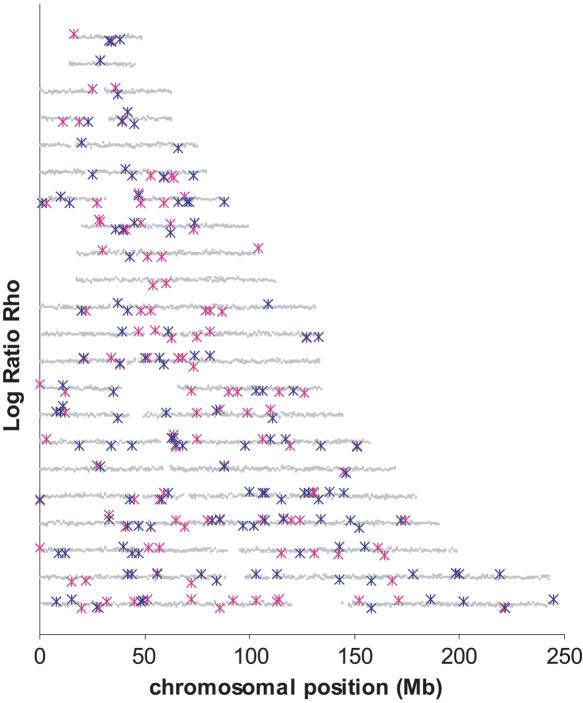
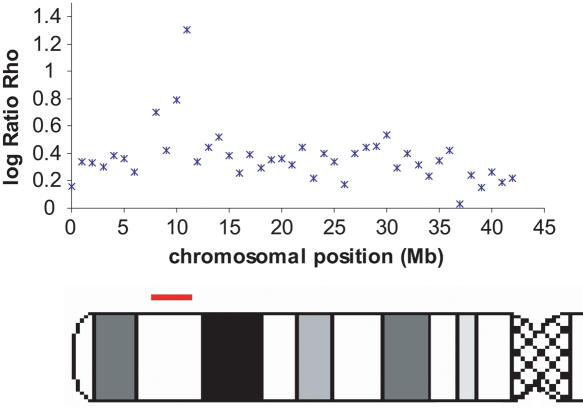
In humans, most recombination events occur in a small fraction of the genome. These hotspots of recombination show considerable variation in intensity and/or location across species and, potentially, across human populations. On a larger scale, the patterns of recombination rates have been mostly investigated in individuals of European ancestry, and it remains unknown whether the results obtained can be directly applied to other human populations. Here, we investigate this question using genome-wide polymorphism data. We show that population recombination rates recapitulate a large part of the genetic map information, regardless of the population considered. We also show that the ratio of the population recombination rate estimate of two populations is overall constant along the chromosomes. These two observations support the hypothesis that large-scale recombination patterns are conserved across human populations. Local deviations from the overall pattern of conservation of the recombination rates can be used to select candidate regions with large polymorphic inversions or under local selection.


Figures

Figure 1.
Figure 1.
Average value of formula image in each population for, respectively, telomeric regions, centromeric regions, and the rest of the genome. The mean values of the European-American population are in blue, of the Han Chinese in pink, and of the African-Americans in green. The bars represent two standard errors from the mean.
Figure 2.
Figure 2.
Plot of the recombination rate estimates for 2609 windows of the human genome. Each point represents a 1-Mb window displayed according to the value of the DeCode recombination rate cmap (on the x-axis) and to the population recombination rate formula image calculated using 23 unrelated individuals from the Perlegen data set (on the y-axis). The estimates for the Han Chinese population are in pink, for the African-Americans in green, and for the European-Americans in blue. The straight lines are the regression lines obtained for each population.
Figure 3.
Figure 3.
Variation of the log10 ratio formula image along Chromosome 1. Each point of the figure represents one window of 1 Mb displayed according to its position on the chromosome (x-axis) and the value of the log ratios formula image. (A) The log ratios formula image are shown in blue; (B) the log ratios formula image are shown in pink; and (C) the log ratios formula image are shown in red. See also Supplemental Figures S2 to S22 online for the variation along Chromosomes 2 to 22.
Figure 4.
Figure 4.
Position of the windows with the 5% most extreme log ratios formula image. The chromosomes are organized according to their number from 1 (lowest y-axis coordinate) to 22 (on top). Each gray point represents the value of the log ratio formula image for one 1-Mb window and is displayed according to its position on the chromosome (on the x-axis). The 5% most extreme log ratios formula image are shown in blue and formula image in pink. See also Supplemental Figure S23 for a blowup of Chromosomes 1 to 5 and Supplemental Figure S24 for the 5% most extreme log ratios formula image.
Figure 5.
Figure 5.
Variation of the log ratios formula image along the chromosomal arm 8p. The position of the polymorphic inversion at 8p23 is shown by the red bar on the chromosome picture.

References

    1. Akey, J.M., Eberle, M.A., Rieder, M.J., Carlson, C.S., Shriver, M.D., Nickerson, D.A., and Kruglyak, L. 2004. Population history and natural selection shape patterns of genetic variation in 132 genes. PLoS Biol. 2: e286. - PMC - PubMed
    1. Box, G.E.P, Jenkins, G.M., and Reinsel, G.C. 1994. Time series analysis: Forecasting and control, 3rd ed. Prentice-Hall, Upper Saddle River, NJ.
    1. Broman, K.W., Murray, J.C., Sheffield, V.C., White, R.L., and Weber, J.L. 1998. Comprehensive human genetic maps: Individual and sex-specific variation in recombination. Am. J. Hum. Genet. 63: 861–869. - PMC - PubMed
    1. Cohen, J., Cohen, P., West, S.G., and Aiken, L.S. 2003. Applied multiple regression/correlation analysis for the behavioral sciences, 3rd ed. LEA Publishers, Mahwah, NJ.
    1. Crawford, D.C., Bhangale, T., Li, N., Hellenthal, G., Rieder, M.J., Nickerson, D.A., and Stephens, M. 2004. Evidence for substantial fine-scale variation in recombination rates across the human genome. Nat. Genet. 36: 700–706. - PubMed

Publication types

LinkOut - more resources