Comparative Study
. 2005 Nov;15(11):1566-75.
doi: 10.1101/gr.4252305.

Genomic scans for selective sweeps using SNP data

Affiliations
Comparative Study

Genomic scans for selective sweeps using SNP data

Rasmus Nielsen et al. Genome Res. 2005 Nov.

Abstract

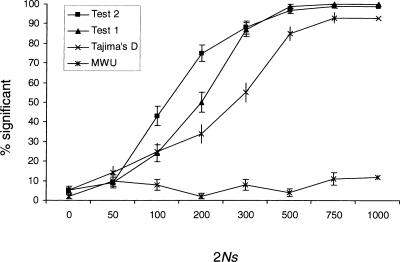
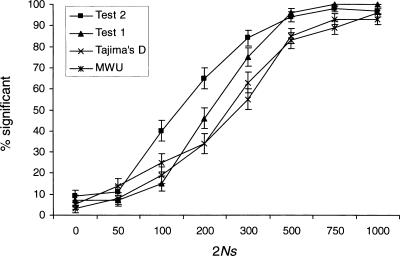
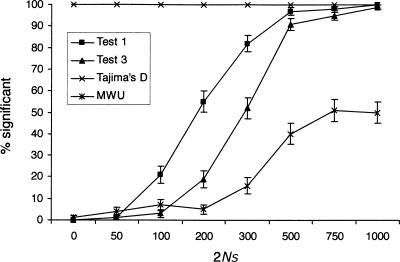
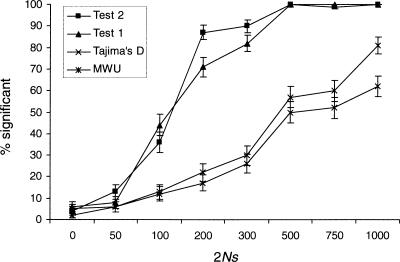
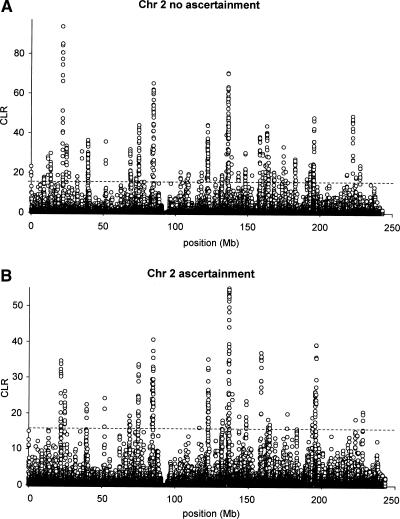
Detecting selective sweeps from genomic SNP data is complicated by the intricate ascertainment schemes used to discover SNPs, and by the confounding influence of the underlying complex demographics and varying mutation and recombination rates. Current methods for detecting selective sweeps have little or no robustness to the demographic assumptions and varying recombination rates, and provide no method for correcting for ascertainment biases. Here, we present several new tests aimed at detecting selective sweeps from genomic SNP data. Using extensive simulations, we show that a new parametric test, based on composite likelihood, has a high power to detect selective sweeps and is surprisingly robust to assumptions regarding recombination rates and demography (i.e., has low Type I error). Our new test also provides estimates of the location of the selective sweep(s) and the magnitude of the selection coefficient. To illustrate the method, we apply our approach to data from the Seattle SNP project and to Chromosome 2 data from the HapMap project. In Chromosome 2, the most extreme signal is found in the lactase gene, which previously has been shown to be undergoing positive selection. Evidence for selective sweeps is also found in many other regions, including genes known to be associated with disease risk such as DPP10 and COL4A3.


Figures

Figure 1.
Figure 1.
The proportion of significant results of the four different tests when applied to the unfolded frequency spectrum, as determined by simulations, assuming a region of 250 kb and a single selective sweep. The power is given as a function of the product of the chromosomal population size (2N) and the selection coefficient (s). Error bars indicate ±1 standard deviation. Each point is calculated using 100 replicate simulations.
Figure 2.
Figure 2.
The proportion of significant results of the four different tests when applied to the folded frequency spectrum (see Fig. 1 for other details).
Figure 3.
Figure 3.
The proportion of significant results of the four different tests under population growth, when an equilibrium model is used as the null model. The simulation details are as in Figure 1, but with a 10-fold reduction in population size N generations ago. The null model assumed is a standard neutral equilibrium model without population growth.
Figure 4.
Figure 4.
The proportion of significant results of the four different tests under population growth, when a growth model is used as the null model. The simulation details are as in Figure 3, but the null model considered is now the correct model, that is, a model with a 10-fold reduction in population size 0.5N generations ago.
Figure 5.
Figure 5.
The distribution of the inferred location of the selective sweep in significant simulations with 2Ns = 500, 750, and 1000. The true location of the selective sweep is at position 125,000.
Figure 6.
Figure 6.
The null distribution of Test 2 different tests under different demographic models described in the text and a recombination rate of (A) 2NR = 0 and (B) 2NR =10–3 per base pair.
Figure 7.
Figure 7.
The null distribution of (A) the Mann-Whitney U (MWU) test, (B) Test 1, and (C) Test 2 under varying assumptions regarding the recombination rate.
Figure 8.
Figure 8.
The maximized composite likelihood surface calculated for the c3 gene calculated from the Seattle SNP database (SeattleSNPs, http://pga.gs.washington.edu [Feb. 2004]). The dotted line indicates the 5% cutoff value as determined by simulations under a standard neutral equilibrium model.
Figure 9.
Figure 9.
The maximized composite likelihood surface calculated for data from Chromosome 2 from the HapMap project (The International HapMap Consortium 2003). The dotted line indicates the 5% cutoff value as determined by simulations under a standard neutral equilibrium model. Results are shown with (B) and without (A) a correction for ascertainment bias.

References

    1. Akashi, H. 1999. Inferring the fitness effects of DNA mutations from patterns of polymorphism and divergence: Statistical power to detect directional selection under stationarity and free recombination. Genetics 151: 221–238. - PMC - PubMed
    1. Akey, J.M., Zhang, G., Zhang, K., Jin, L., and Shriver, M.D. 2002. Interrogating a high-density SNP map for signatures of natural selection. Genome Res. 12: 1805–1814. - PMC - PubMed
    1. Barton, N.H. 1998. The effect of hitch-hiking on neutral genealogies. Genet. Res. 72: 123–133.
    1. Barton, N.H. and Etheridge, A.M. 2004. The effect of selection on genealogies. Genetics 166: 1115–1131. - PMC - PubMed
    1. Bersaglieri, T., Sabeti, P.C., Patterson, N., Vanderploeg, T., Schaffner, S.F., Drake, J.A., Rhodes, M., Reich, D.E., and Hirschhorn, J.N. 2004. Genetic signatures of strong recent positive selection at the lactase gene. Am. J. Hum. Genet. 74: 1111–1120. - PMC - PubMed

Web site references

    1. http://pga.gs.washington.edu; the Seattle SNP database [Feb. 2004]—SeattleSNPs. NHLBI Program for Genomic Applications, SeattleSNPs, Seattle, WA.

Publication types