. 2005 Nov;77(5):807-23.
doi: 10.1086/497438. Epub 2005 Sep 26.

Promoter and 3'-untranslated-region haplotypes in the vitamin d receptor gene predispose to osteoporotic fracture: the rotterdam study

Affiliations

Promoter and 3'-untranslated-region haplotypes in the vitamin d receptor gene predispose to osteoporotic fracture: the rotterdam study

Yue Fang et al. Am J Hum Genet. 2005 Nov.

Abstract

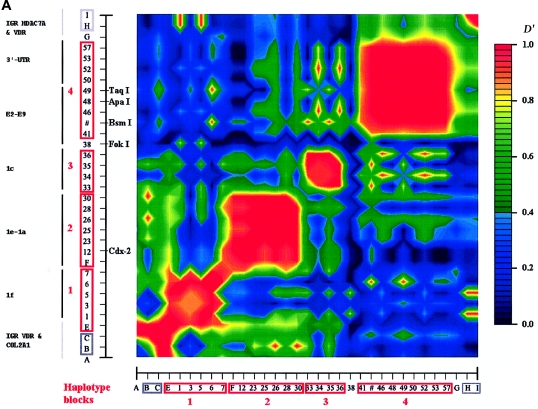
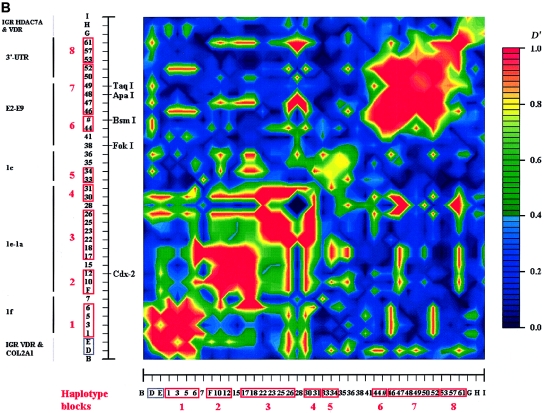
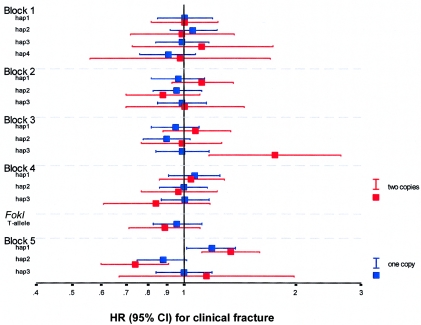
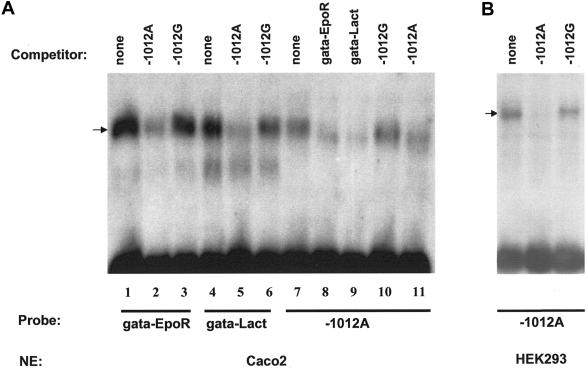
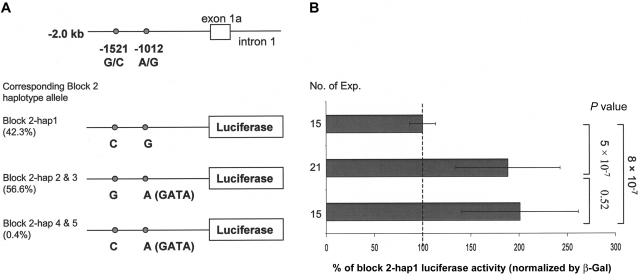
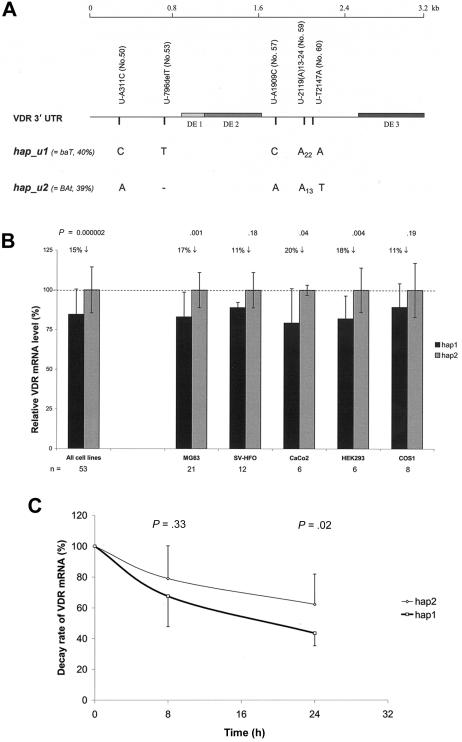
Polymorphisms of the vitamin D receptor gene (VDR) have been shown to be associated with several complex diseases, including osteoporosis, but the mechanisms are unknown and study results have been inconsistent. We therefore determined sequence variation across the major relevant parts of VDR, including construction of linkage disequilibrium blocks and identification of haplotype alleles. We analyzed 15 haplotype-tagging SNPs in relation to 937 clinical fractures recorded in 6,148 elderly whites over a follow-up period of 7.4 years. Haplotype alleles of the 5' 1a/1e, 1b promoter region and of the 3' untranslated region (UTR) were strongly associated with increased fracture risk. For the 16% of subjects who had risk genotypes at both regions, their risk increased 48% for clinical fractures (P = .0002), independent of age, sex, height, weight, and bone mineral density. The population-attributable risk varied between 1% and 12% for each block and was 4% for the combined VDR risk genotypes. Functional analysis of the variants demonstrated 53% lower expression of a reporter construct with the 1e/1a promoter risk haplotype (P = 5 x 10(-7)) in two cell lines and 15% lower mRNA level of VDR expression constructs carrying 3'-UTR risk haplotype 1 in five cell lines (P = 2 x 10(-6)). In a further analysis, we showed 30% increased mRNA decay in an osteoblast cell line for the construct carrying the 3'-UTR risk haplotype (P = .02). This comprehensive candidate-gene analysis demonstrates that the risk allele of multiple VDR polymorphisms results in lower VDR mRNA levels. This could impact the vitamin D signaling efficiency and might contribute to the increased fracture risk we observed for these risk haplotype alleles.


Figures

Figure  1
Figure 1
Genomic structure and LD map of the human VDR gene. a, Physical organization of the 12q12 area containing VDR, mostly based on the Celera database (47032–47145 kb at chromosome 12q12). The arrows for each gene indicate the transcription direction, and distances are in kb. b, Genomic structure of the human VDR gene. Black bars indicate the coding exons of VDR, and the gray bars indicate 5′ exons and the 3′ UTR. c, Sequenced areas and positions of the 62 variations. Gray bars in the 3′-UTR indicate destabilizing elements (DE 1, 2, and 3 [Durrin et al. 1999]). The sequence-variation numbers refer to those given in table 3. d, Haplotype map of VDR in whites, Asians, and African Americans, based on SNPs with an MAF ⩾5% in each of the different ethnic populations. Common haplotype alleles in each block with a frequency >3% are presented below the blocks. SNPs and alleles in red indicate htSNPs. Fracture-risk haplotype alleles are underlined. The correspondence is shown for whites to haplotypes in block 5 of the BsmI-ApaI-TaqI haplotype alleles we defined elsewhere (Uitterlinden et al. 1996).
Figure  2
Figure 2
Conservation of the human and mouse genomic VDR gene sequence. The Y-axis is the homology rate between human and mouse; the X-axis is the physical distance on the human VDR gene. All exons are indicated in purple, the 3′ UTR in light green, and the conserved noncoding region in red. The small black bars on the top of each frame indicate the polymorphisms we observed by resequencing, and the gray arrow on top indicates the transcription direction of VDR.
Figure  3
Figure 3
LD structure of VDR in whites. a, Blocks with pairwise D>0.8 are numbered 1–5. The analyzed SNPs (table 1) include 39 VDR SNPs, 5 SNPs in the COL2A1 and VDR intergenic region (“IGR VDR & COL2A1”), and 3 SNPs in the VDR and HDAC7A intergenic region (“IGR HDAC7A & VDR”). SNP IDs correspond to those in figure 1 and tables 1 and 3. The red boxes on the X- and Y-axes indicate the high-LD blocks used to define haplotype alleles. The physical organization of VDR is represented with vertical lines on the Y-axis (see also fig. 1). b, Aligned LD analyses from different sources and estimated consensus LD structure of VDR. The total number of SNPs analyzed in each study is indicated in parentheses. Thick lines indicate haplotype blocks, with the number of analyzed SNPs below the line and the name of the block above the line.
Figure  4
Figure 4
LD maps of VDR in different ethnic groups. a, LD map of 33 SNPs in 107 Asians (214 chromosomes). b, LD map of 41 SNPs in 58 African Americans (116 chromosomes).
Figure  4
Figure 4
LD maps of VDR in different ethnic groups. a, LD map of 33 SNPs in 107 Asians (214 chromosomes). b, LD map of 41 SNPs in 58 African Americans (116 chromosomes).
Figure  5
Figure 5
HR for clinical fracture, by VDR genotypes based on haplotype alleles in five haplotype blocks (1–5) and the FokI RFLP. The HR point estimates and the surrounding 95% CIs are represented with colored squares and lines. The HR for one copy of the test allele versus no copy is in blue; the HR for two copies of the allele versus no copy is in red. The logarithmic HR is plotted for the common haplotype alleles (frequency >3%) in all haplotype blocks (see fig. 1d for whites) and the FokI RFLP.
Figure  6
Figure 6
EMSA of 1a-A−1012G for GATA protein. a, GATA binding assay using Caco2 cell-line nuclear extract. The binding of GATA to the 1a−1012A site was analyzed in competition experiments for Caco2 nuclear extract by use of the well-characterized GATA sites of the EpoR and Lactase gene promoters (Zon et al. ; Fang et al. 2001). These experiments showed similar binding characteristics of the complexes bound to the 1a−1012A site and to the other GATA sites (compare lane 7 to lanes 1 and 4). In addition, the signal found on the 1a−1012A site was eliminated by a 100-fold excess of unlabeled GATA sites of the EpoR and Lactase genes (see lanes 7–10). Conversely, a 100-fold excess of the 1a−1012A site eliminated the binding of GATA to the EpoR and Lactase GATA sites (lane 1 vs. 2 and lane 4 vs. 5). b, GATA binding using HEK293 cell-line nuclear extract. Competition experiments for HEK293 nuclear extract using the −1012 GATA site as a probe revealed that the 1a−1012G variant was unable to compete with the binding of the 1a−1012A variant.
Figure  7
Figure 7
Relative luciferase activity in HEK293 cells of VDR exon 1a promoter sequences, including two SNPs. a, The three constructs containing the 2-kb 1a promoter sequence with SNPs 1a-G−1521C and 1a-A−1012G. b, β-galactosidase (beta-Gal)–normalized luciferase activity for the three constructs. The block 2–hap1 allele is set at 100% to be the reference group; P values were calculated by independent t test.
Figure  8
Figure 8
Two SNPs in the 1e promoter region of the human VDR gene, located at a Cdx-2 binding site. a, Alignment of 15 well-characterized Cdx-2 sites from mammalian gene promoters. Base usage is summarized in a table and is compared with DNA sequences surrounding SNPs 1e-C−2090T and 1e-G−1739A. DNA bases involved in SNPs are underlined. b, EMSA experiments performed using Caco-2 cell nuclear extracts. Double-strand oligonucleotides containing the sucrose isomaltase (SIF) Cdx2-binding site as a control or sequences encompassing SNPs 1e-C−2090T and 1e-G−1739A were 32P-labeled and were purified on a 10% polyacrylamide gel. The competition experiments were done with an oligonucleotide containing the SIF element. Gel-shift experiments were performed in the absence (−) or presence (+) of a 100-fold excess of cold SIF probe as a competitor, which resulted in relatively more elimination of these specific complexes for the A allele of 1e-G−1739A and the T allele of 1e-C−2090T than for their allelic counterparts. c, Antibody experiments with monoclonal anti–Cdx-2. EMSA was performed with nuclear extract alone (−) or in the presence of monoclonal anti–Cdx-2 antibody (+). Supershift complexes are identified by an arrow. A clear supershift was observed with SIF, but it had a weak signal with 1e−1739G, and a very low intensity of the complex was seen with 1e−2090. Comparison of the surrounding 1e-C−2090T and 1e-G−1739A sequences with the consensus Cdx-2 sequence (panel a) evidenced the presence of a substitution (T→A) in the 1a−2090 sequence, somehow corrupting the Cdx-2 site, which may explain the lower intensity observed in EMSA for this sequence compared with 1e-G−1739A.
Figure  9
Figure 9
VDR mRNA expression level and stability analysis by 3′-UTR haplotypes in different cell lines. a, VDR 3′-UTR with sequence variations that distinguish hap1 (corresponding to block 5–hap1) from hap2 (corresponding to block 5–hap2). The SNP variation number (in parentheses) refers to those given in table 3. b, Neomycin-normalized VDR mRNA expression levels (mean ± SD) for VDR 3′-UTR hap1 versus hap2. The level of hap2 is set at 100% to be the reference group; P values were calculated by independent t test; n = number of experiments for each cell line. c, Decay rate of VDR mRNA by hap1 versus hap2, determined in the MG63 cell line. Time point 0 h is defined as 100% mRNA level for both haplotypes; P values for each time point were calculated by independent t test.

References

Web Resources

    1. Applied Biosystems SNPbrowser Software, http://events-na.appliedbiosystems.com/mk/get/snpb_landing?isource=fr_E_...
    1. dbSNP, http://www.ncbi.nlm.nih.gov/SNP/ (for detected polymorphisms [accession numbers ss32465817–ss32465820 and ss32465633–ss32465690])
    1. GenBank, http://www.ncbi.nlm.nih.gov/Genbank/index.html (for reference sequences [accession numbers BV210413–BV210452 and AY827085–AY827088])
    1. Genomatix, http://www.genomatix.de/cgi-bin/./matinspector_prof/mat_fam.pl
    1. GOLD, http://www.sph.umich.edu/csg/abecasis/GOLD

References

    1. Arai H, Miyamoto KI, Yoshida M, Yamamoto H, Taketani Y, Morita K, Kubota M, Yoshida S, Ikeda M, Watabe F, Kanemasa Y, Takeda E (2001) The polymorphism in the caudal-related homeodomain protein Cdx-2 binding element in the human vitamin D receptor gene. J Bone Miner Res 16:1256–1264 - PubMed
    1. Baker AR, McDonnell DP, Hughes M, Crisp TM, Mangelsdorf DJ, Haussler MR, Pike JW, Shine J, O’Malley BW (1988) Cloning and expression of full-length cDNA encoding human vitamin D receptor. Proc Natl Acad Sci USA 85:3294–3298 - PMC - PubMed
    1. Brown SB, Brierley TT, Palanisamy N, Salusky IB, Goodman W, Brandi ML, Drueke TB, Sarfati E, Urena P, Chaganti RS, Pike JW, Arnold A (2000) Vitamin D receptor as a candidate tumor-suppressor gene in severe hyperparathyroidism of uremia. J Clin Endocrinol Metab 85:868–872 - PubMed
    1. Burger H, van Daele PL, Algra D, van den Ouweland FA, Grobbee DE, Hofman A, van Kuijk C, Schutte HE, Birkenhager JC, Pols HA (1994) The association between age and bone mineral density in men and women aged 55 years and over: the Rotterdam Study. Bone Miner 25:1–13 - PubMed
    1. Carling T, Ridefelt P, Hellman P, Rastad J, Akerstrom G (1997) Vitamin D receptor polymorphisms correlate to parathyroid cell function in primary hyperparathyroidism. J Clin Endocrinol Metab 82:1772–1775 - PubMed

Publication types

Associated data