. 2005 Nov;77(5):869-86.
doi: 10.1086/497613. Epub 2005 Sep 29.

The heritage of pathogen pressures and ancient demography in the human innate-immunity CD209/CD209L region

Affiliations

The heritage of pathogen pressures and ancient demography in the human innate-immunity CD209/CD209L region

Luis B Barreiro et al. Am J Hum Genet. 2005 Nov.

Abstract

The innate immunity system constitutes the first line of host defense against pathogens. Two closely related innate immunity genes, CD209 and CD209L, are particularly interesting because they directly recognize a plethora of pathogens, including bacteria, viruses, and parasites. Both genes, which result from an ancient duplication, possess a neck region, made up of seven repeats of 23 amino acids each, known to play a major role in the pathogen-binding properties of these proteins. To explore the extent to which pathogens have exerted selective pressures on these innate immunity genes, we resequenced them in a group of samples from sub-Saharan Africa, Europe, and East Asia. Moreover, variation in the number of repeats of the neck region was defined in the entire Human Genome Diversity Panel for both genes. Our results, which are based on diversity levels, neutrality tests, population genetic distances, and neck-region length variation, provide genetic evidence that CD209 has been under a strong selective constraint that prevents accumulation of any amino acid changes, whereas CD209L variability has most likely been shaped by the action of balancing selection in non-African populations. In addition, our data point to the neck region as the functional target of such selective pressures: CD209 presents a constant size in the neck region populationwide, whereas CD209L presents an excess of length variation, particularly in non-African populations. An additional interesting observation came from the coalescent-based CD209 gene tree, whose binary topology and time depth (approximately 2.8 million years ago) are compatible with an ancestral population structure in Africa. Altogether, our study has revealed that even a short segment of the human genome can uncover an extraordinarily complex evolutionary history, including different pathogen pressures on host genes as well as traces of admixture among archaic hominid populations.


Figures

Figure  1
Figure 1
Scaled diagram of the CD209/CD209L genomic region. Sequenced regions are represented in gray. For CD209, we sequenced a total of 5,500 bp per chromosome, and, for CD209L, 5,391 bp per chromosome. The neck region corresponding to exon 4 and composed of seven coding repeats is also shown.
Figure  2
Figure 2
Inferred haplotypes for CD209 (A) and CD209L (B). The chimpanzee sequence was used to deduce the ancestral state at each position, except for the CD209L positions 1232, 1236, and 1240. For those polymorphisms, the ancestral state was considered to be the most frequent allele. Dark boxes correspond to the derived state at each position. The numbers on the right of the figure indicate the absolute frequency of each haplotype in the different populations studied. Repeat-number variation in the neck region of each gene is reported in the gray columns with the column heads “NR.” Indel polymorphisms are referred as to “1” for insertion and “0” for deletion.
Figure  3
Figure 3
Pairwise D′ LD plots in non-African and African populations. European and East Asian samples were plotted together as “non-Africans” because they showed similar levels of LD (data not shown). Red tags indicate the physical position of each SNP across the genomic region studied. Blue and green lines label the SNPs (MAF>10%) used for CD209 and CD209L, respectively, in the LD plot. For CD209, 47 SNPs presented an MAF>10% in the African sample and 5 in the non-African, whereas, for CD209L, 18 SNPs showed an MAF>10% in Africans and 20 in non-Africans. The high prevalence of SNPs with MAF>10% for CD209 in Africa is due to the presence of the highly divergent cluster A, which presents 35 diagnostic variants with a frequency of 15%.
Figure  4
Figure 4
Estimates of the hotspot intensity (λ) for Africans, Europeans, and East Asians. Estimates of the population recombination rate (ρ) for each population as well as the posterior probabilities of λ>1 and λ>10 are also reported in the key.
Figure  5
Figure 5
Geographical distribution of the neck-region repeat variation in CD209 (A) and CD209L (B). Population codes are (1) Algerians; (2) Mandenka; (3) Yoruba; (4) Biaka Pygmies; (5) Northeastern Bantu from Kenya; (6) Mbuti Pygmies; (7) San; (8) South African Bantu southeastern/southwestern; (9) French and Basque from France; (10) Italian composite from Bergamo, Tuscany, and Sardinia; (11) Orcadian; (12) Russians; (13) Adygei; (14) Middle Eastern composite sample of Druze, Palestinian, and Bedouin; (15) Yakut; (16) Pakistani composite sample; (17) Chinese composite sample; (18) Japanese; (19) Cambodian; (20) Papuan; (21) Melanesian; (22) Pima; (23) Maya; (24) Piapoco and Curripaco; (25) Surui; and (26) Karitiana. For populations 16 and 17, we have pooled the different Pakistani and Chinese individual populations, respectively. For population details of these two composite groups, see the HGDP-CEPH Web site.
Figure  6
Figure 6
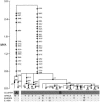
CD209 estimated gene tree. Time scale is in MYA. Mutations are represented as black dots and are named for their physical position along CD209. For branches with multiple mutations, order in time is arbitrary. Lineage absolute frequencies in Africa, Europe, and East Asia are reported.
Figure  7
Figure 7
Coalescent-based simulations (2×10⁴) of the expected TMRCA distribution of CD209.

References

Web Resources

    1. Arlequin, http://lgb.unige.ch/arlequin/
    1. BOTTLENECK, http://www.montpellier.inra.fr/CBGP/softwares/bottleneck/bottleneck.html
    1. Center for Statistical Genetics, http://www.sph.umich.edu/csg/abecasis/GOLD/ (for GOLD software)
    1. Centre National de Genotypage, http://software.cng.fr/ (for GENALYS software)
    1. DnaSP, http://www.ub.es/dnasp/

References

    1. Abecasis GR, Cookson WO (2000) GOLD—graphical overview of linkage disequilibrium. Bioinformatics 16:182–183 - PubMed
    1. Akey JM, Eberle MA, Rieder MJ, Carlson CS, Shriver MD, Nickerson DA, Kruglyak L (2004) Population history and natural selection shape patterns of genetic variation in 132 genes. PLoS Biol 2:e286 - PMC - PubMed
    1. Akey JM, Zhang G, Zhang K, Jin L, Shriver MD (2002) Interrogating a high-density SNP map for signatures of natural selection. Genome Res 12:1805–1814 - PMC - PubMed
    1. Alvarez CP, Lasala F, Carrillo J, Muniz O, Corbi AL, Delgado R (2002) C-type lectins DC-SIGN and L-SIGN mediate cellular entry by Ebola virus in cis and in trans. J Virol 76:6841–6844 - PMC - PubMed
    1. Appelmelk BJ, van Die I, van Vliet SJ, Vandenbroucke-Grauls CM, Geijtenbeek TB, van Kooyk Y (2003) Cutting edge: carbohydrate profiling identifies new pathogens that interact with dendritic cell-specific ICAM-3-grabbing nonintegrin on dendritic cells. J Immunol 170:1635–1639 - PubMed

Publication types

MeSH terms