

Case Reports
doi: 10.1016/j.hrthm.2005.08.019.
Electrocardiographic imaging (ECGI), a novel diagnostic modality used for mapping of focal left ventricular tachycardia in a young athlete
Affiliations
- PMID: 16253916
- PMCID: PMC2000800
- DOI: 10.1016/j.hrthm.2005.08.019
Item in Clipboard
Case Reports
Electrocardiographic imaging (ECGI), a novel diagnostic modality used for mapping of focal left ventricular tachycardia in a young athlete
Heart Rhythm.
2005 Nov.
Abstract
We report the first clinical application of electrocardiographic imaging (ECGI), a new, noninvasive imaging modality for arrhythmias, in an athlete with focal ventricular tachycardia (VT) originating from a left ventricular (LV) diverticulum. A reconstructed map of the epicardial activation sequence during a single premature ventricular complex (PVC) of an identical QRS morphology to the clinical VT, generated from 224-electrode body surface ECGs and a chest CT (ECGI), localized the PVC to the site of the diverticulum. This correlated with subsequent maps obtained using standard techniques. We describe the first case that used ECGI to guide diagnosis and therapy of a clinical tachyarrhythmia.
Figures
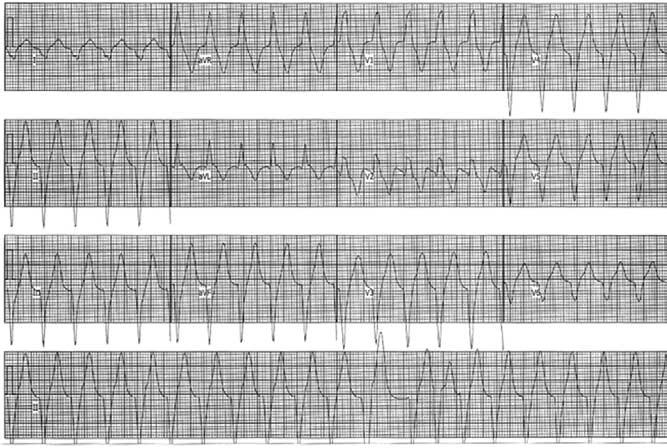
Twelve-lead ECG of the patient's clinical tachycardia. Rhythm strip is shown in the bottom panel is lead II. Paper speed = 25 mm/second.
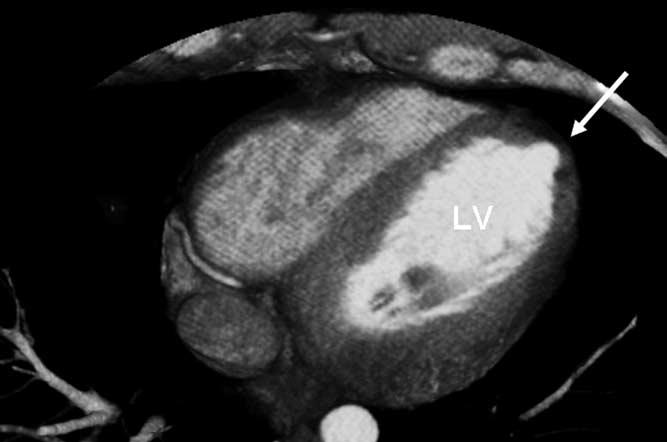
Cardiac CT scan of a cross section of the LV. Note the small LV apical diverticulum (arrow).
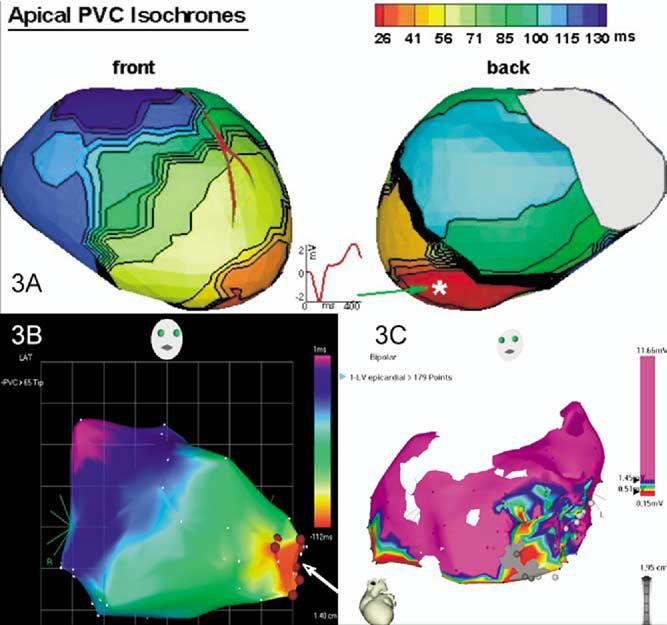
Comparison of three different modalities of mapping in this patient with focal VT. A Reconstructed activation map of a single PVC using noninvasive ECGI. A reconstructed epicardial electrogram from the PVC site of origin (asterisk) is also shown. B Endocardial activation map of the LV chamber using three-dimensional electroanatomic (CARTO) mapping of PVCs—right anterior oblique view. Ablation sites are shown (arrow). C Because of the infrequent PVCs, the epicardial map was obtained during sinus rhythm. All sites with a bipolar electrogram amplitude >1.45 mV are shown as purple. A low-amplitude region is present at the apex, including regions that are electrically unexcitable to pacing at 10 mA (2-ms pulse width). The gray circles are sites where pacing captured the phrenic nerve. Pace mapping in the low-voltage region produced a QRS morphology similar to that of the PVCs (not shown). Respective time scales are shown in panels A and B. Voltage scale is shown in panel C.
References
-
- Rudy Y, Burnes JE. Noninvasive electrocardiographic imaging (ECGI) Ann Noninvas Electrocardiol. 1999;4:340–359.
-
- Taccardi B, Punske B. Body surface potential mapping. In: Zipes DP, Jalife J, editors. Cardiac electrophysiology: from cell to bedside. WB Saunders; Philadelphia: 2004. pp. 803–811.
-
- Gulrajani RM. The forward and inverse problems of Electrocardiography. IEEE Eng Med Biol Mag. 1998;17:84–101. - PubMed
-
- Oster HS, Taccardi B, Lux RL, Ershler PR, Rudy Y. Noninvasive electrocardiographic imaging: reconstruction of epicardial potentials, electrograms, and isochrones and localization of single and multiple electrocardic events. Circulation. 1997;96:1012–1024. - PubMed
Publication types
MeSH terms
Grants and funding
LinkOut - more resources
Full Text Sources
Other Literature Sources
