. 2006 Jan 15;570(Pt 2):237-50.
doi: 10.1113/jphysiol.2005.096578. Epub 2005 Oct 27.

Long-QT syndrome-related sodium channel mutations probed by the dynamic action potential clamp technique

Affiliations

Long-QT syndrome-related sodium channel mutations probed by the dynamic action potential clamp technique

Géza Berecki et al. J Physiol. .

Abstract

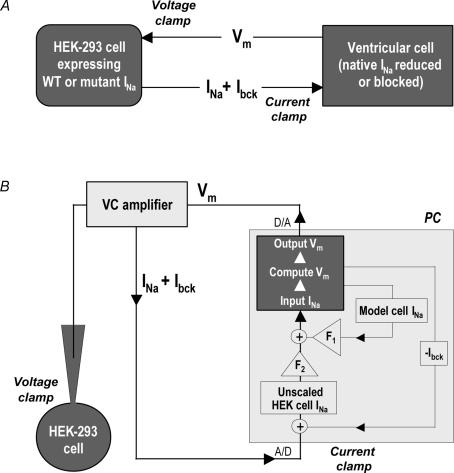
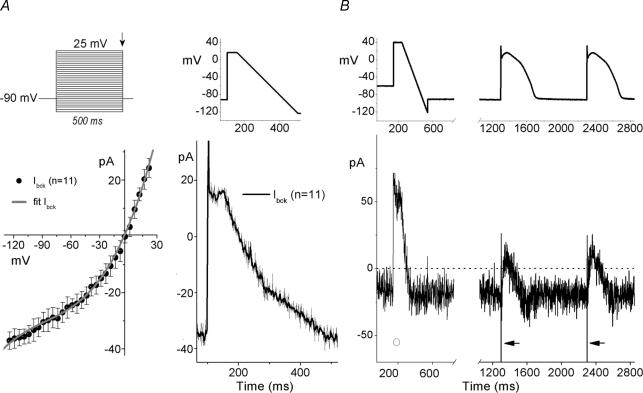
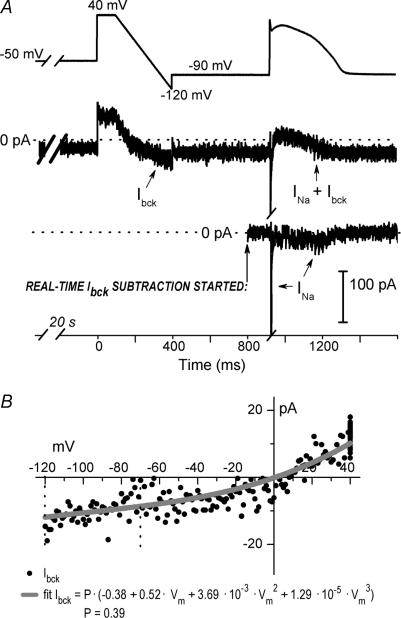
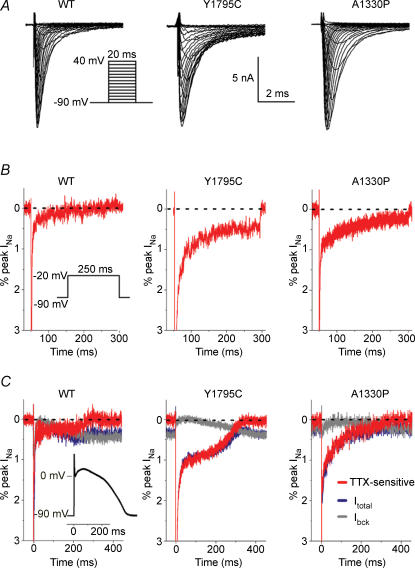
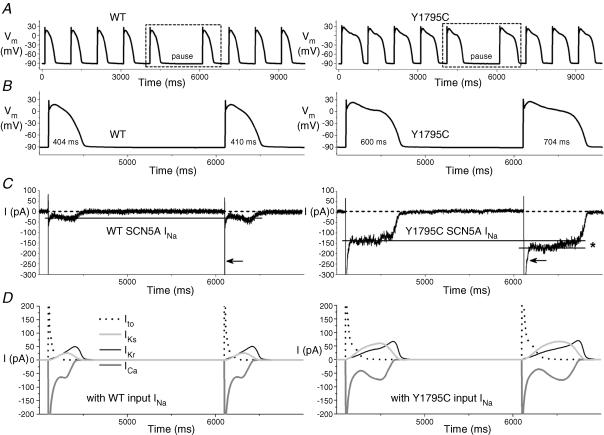
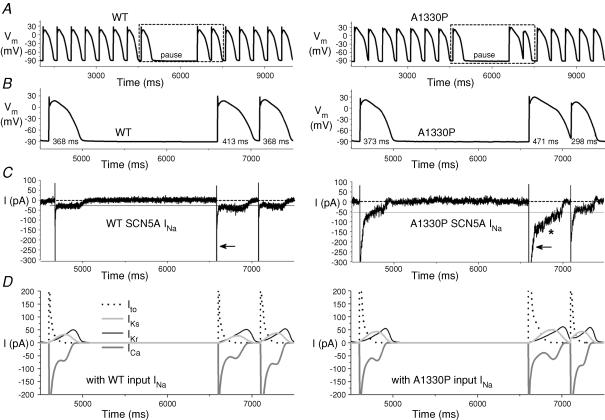
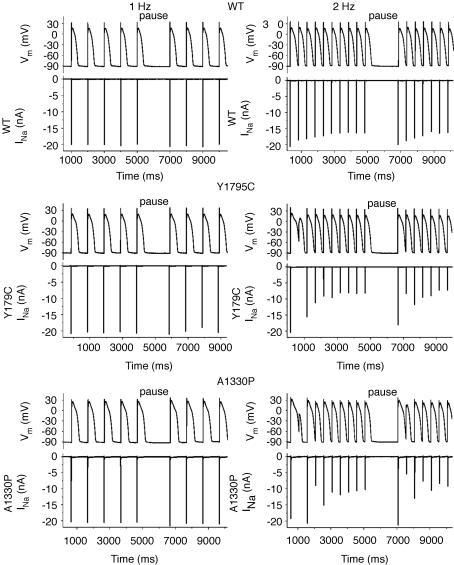
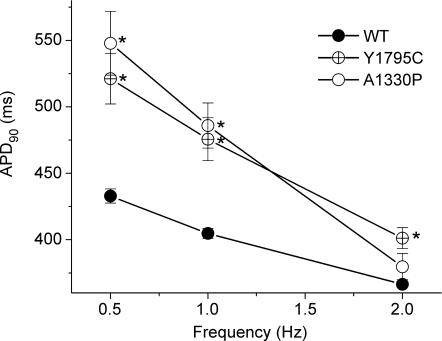
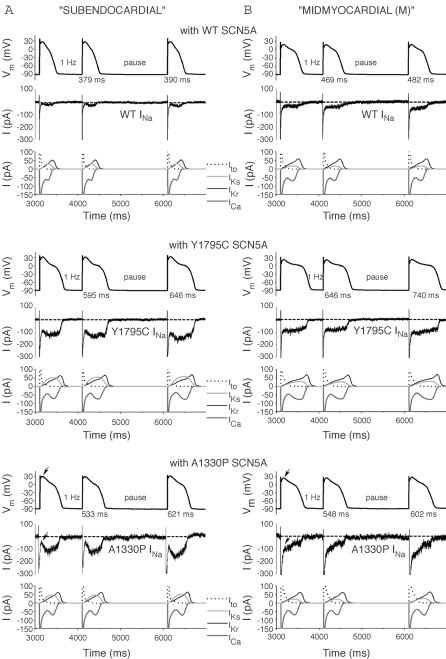
Long-QT3 syndrome (LQT3) is linked to cardiac sodium channel gene (SCN5A) mutations. In this study, we used the 'dynamic action potential clamp' (dAPC) technique to effectively replace the native sodium current (I(Na)) of the Priebe-Beuckelmann human ventricular cell model with wild-type (WT) or mutant I(Na) generated in a human embryonic kidney (HEK)-293 cell that is voltage clamped by the free-running action potential of the ventricular cell. We recorded I(Na) from HEK cells expressing either WT or LQT3-associated Y1795C or A1330P SCN5A at 35 degrees C, and let this current generate and shape the action potential (AP) of subepicardial, mid-myocardial and subendocardial model cells. The HEK cell's endogenous background current was completely removed by a real-time digital subtraction procedure. With WT I(Na), AP duration (APD) was longer than with the original Priebe-Beuckelmann model I(Na), due to a late I(Na) component of approximately 30 pA that could not be revealed with conventional voltage-clamp protocols. With mutant I(Na), this late component was larger ( approximately 100 pA), producing a marked increase in APD ( approximately 70-80 ms at 1 Hz for the subepicardial model cell). The late I(Na) magnitude showed reverse frequency dependence, resulting in a significantly steeper APD-frequency relation in the mutant case. AP prolongation was more pronounced for the mid-myocardial cell type, resulting in increased APD dispersion for each of the mutants. For both mutants, a 2 s pause following rapid (2 Hz) pacing resulted in distorted AP morphology and beat-to-beat fluctuations of I(Na). Our dAPC data directly demonstrate the arrhythmogenic nature of LQT3-associated SCN5A mutations.


Figures

Figure 1
Figure 1. Dynamic action potential clamp (dAPC) technique
A, general experimental design. The cardiac ventricular cell is in current clamp. The SCN5A cDNA-transfected HEK cell is voltage clamped with Vm of the ventricular cell. INa from the HEK cell is continuously applied to the ventricular cell as an external current input, partly or entirely replacing INa in the myocyte. B, model cell mode of dAPC technique: after real-time digital subtraction of HEK cell Ibck, INa from the HEK cell is scaled by factor F2; model cell INa density is reduced to 40% of the original value (scaling factor F1). The INa of the PB model cell incorporates a ‘heterozygous’INa composed of reduced model cell INa and scaled HEK cell (input) INa(+). The Vm of the human ventricular cell model is computed in real time using the thus-obtained INa and applied as voltage-clamp command potential to the HEK cell, thus establishing dAPC.
Figure 2
Figure 2. Square wave-, step-ramp-, and AP-elicited currents in HEK-293 cells
A, Ibck in non-transfected HEK cells. Upper left panel depicts the voltage-step protocol; lower left panel shows the corresponding IbckV, determined from amplitudes at the end of the 500-ms voltage steps (arrow). The fit (continuous line) is a third-order polynomial equation (see text for details). A step-ramp waveform (upper right panel) was used to determine time-course of averaged Ibck (lower right panel). B, step-ramp and ‘subepicardial’-type AP-waveforms (top) to activate Ibck (bottom) in a WT SCN5A cDNA-transfected HEK cell (representative examples). Note the absence (○) and the presence (arrows) of fast INa, as a function of Vhold of −60 mV and −90 mV, respectively (see text for details). APs were generated using the PB model cell; broken line shows zero current level; peak INa is off scale.
Figure 3
Figure 3. Real-time HEK-293 cell Ibck subtraction in a dAPC experiment, using a WT SCN5A cDNA-transfected HEK-293 cell
A, step-ramp voltage protocol and the first AP elicited in a subepicardial model cell. The maximum diastolic potential (MDP) during dAPC was −90 mV (top); Middle: INa in the presence of Ibck (arrows) and after Ibck removal (bottom). Note the transient WT late INa during AP repolarization. Broken line shows zero current level. B, I–V relationship of Ibck in the experiment shown in A, fit with the scaled polynomial equation (P= 0.39) (see text for details).
Figure 4
Figure 4. Whole-cell currents in HEK-293 cells transfected with WT, Y1795C, or A1330P cDNAs
A, representative INa traces. The voltage protocol is shown as an inset. Interpulse interval was 2 s. B, typical, 250 ms step depolarization-evoked TTX-sensitive whole-cell INa traces obtained by subtraction and plotted as percentage of peak INa; inset: protocol. Note that late INa is hardly detectable with WT SCN5A channels upon a step depolarization. Peak currents are off scale; broken lines indicate zero current level. C, superimposed tracing of AP clamp-evoked currents: control (Itotal, blue), TTX-resistant (Ibck, grey), and difference (TTX-sensitive, red). Currents were plotted as percentage of peak INa; to record WT and mutant INa traces, the same cells were used as in B; in all cases INa was ∼10 nA; peak currents are off scale; broken line shows zero current level. AP clamp waveform shown as inset.
Figure 5
Figure 5. Dynamic action potential clamp with WT or Y1795C INa
A, subepicardial cell APs elicited at 1 Hz before and after a 2 s pause. APs with mutant INa are prolonged compared to WT (see Table 1). B, boxed APs from A and associated INa in C, on expanded time scale. HEK cell INas were scaled to identical peak amplitudes (21 nA), and applied to the ‘subepicardial’ PB model cell as an external current input. Note that late INa-increase after the pause is more pronounced with the mutant (*). Broken line shows zero current level; peak INa is off scale; note the slower time-course of peak INa-inactivation of the mutant compared to the WT (arrows). D, relationship between the APs from B and selected membrane current components of the PB model cell, showing the changes in the time-course of transient outward K+ current (Ito), slowly and rapidly activating components of the delayed rectifier K+ current (IKs and IKr, respectively), and L-type Ca2+ current (ICa), along with changes in mutant INa.
Figure 6
Figure 6. Prolonging effects of the A1330P mutation are reduced at fast stimulation rate
A, subepicardial cell APs generated with WT or A1330P INa, at 2 Hz. B, boxed APs from A and C, associated INas. After a 2 s pause, late A1330P INa increases (*), resulting in a prolonged AP; note the slower time-course of peak A1330P INa inactivation compared to that of WT (arrows). D, selected associated individual membrane currents in the PB model cell.
Figure 7
Figure 7. Representative examples of the effects of pacing rate and of a pause on WT or mutant peak INas
APs were recorded from a ‘subepicardial’ cell successively coupled to HEK cells transfected with WT (top), Y1795C (middle) or A1330P (bottom) channels. A normal (WT) response is shown in the top panels, while APs in LQT syndrome are prolonged compared to normal (middle and bottom). At 2 Hz, after the pause, the extent of AP prolongation is exaggerated and heterogeneous. Note the corresponding INas.
Figure 8
Figure 8. AP duration at 90% repolarization (APD90) with the subepicardial cell with WT or mutant INas
See Table 1 for n at 1 and 2 Hz; at 0.5 Hz n was ≥ 6 in all cases. *Significant difference versus control (P < 0.05 for mutant versus WT).
Figure 9
Figure 9. AP prolongation caused by the Y1795C and A1330P mutations in ‘subendocardial’ (A) and ‘M’ (B) cells
Representative APs (top) at 1 Hz, the corresponding HEK cell INa (middle), and associated individual membrane currents in the PB model cell (bottom). AP prolongation was exaggerated in subendocardial and M cells compared to subepicardial cells. The same input (WT, Y1795C, or A1330P) INa peak amplitude was used in A and B, respectively. Arrows in bottom panels indicate plateau amplitude and the corresponding late INa amplitude.

References

    1. An RH, Wang XL, Kerem B, Benhorin J, Medina A, Goldmit M, Kass RS. Novel LQT-3 mutation affects Na+ channel activity through interactions between α- and β1-subunits. Circ Res. 1998;83:141–146. - PubMed
    1. Bennett PB, Yazawa K, Makita N, George AL., Jr Molecular mechanism for an inherited cardiac arrhythmia. Nature. 1995;376:683–685. - PubMed
    1. Berecki G, Zegers JG, Verkerk AO, Bhuiyan ZA, de Jonge B, Veldkamp MW, Wilders R, van Ginneken AC. HERG channel (dys) function revealed by dynamic action potential clamp technique. Biophys J. 2005;88:566–578. - PMC - PubMed
    1. Carmeliet E. Intracellular Ca2+ concentration and vate adaptatior of the cardiac action potential. Cell Calcium. 2004;35:557–573. - PubMed
    1. Catterall WA. From ionic currents to molecular mechanisms: the structure and function of voltage-gated sodium channels. Neuron. 2000;26:13–25. - PubMed

Publication types

MeSH terms

Substances

LinkOut - more resources