

State and metropolitan-area estimates of disability in the United States, 2001
- PMID: 16254230
- PMCID: PMC1449469
- DOI: 10.2105/AJPH.2004.047308
State and metropolitan-area estimates of disability in the United States, 2001
Abstract
Objectives: We sought to provide estimates of disability prevalence for states and metropolitan areas in the United States.
Methods: We analyzed Behavioral Risk Factor Surveillance System data from 2001 for all 50 states and the District of Columbia and 103 metropolitan areas. We performed stratified analyses by demographics for 20 metropolitan areas with the highest prevalence of disability.
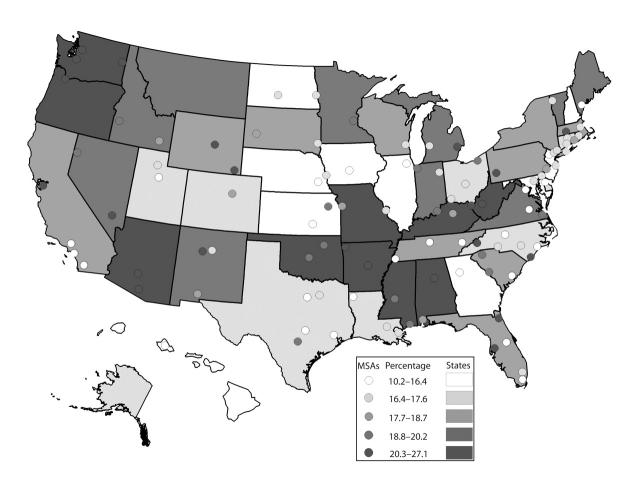
Results: State disability estimates ranged from 10.5% in Hawaii to 25.9% in Arizona. Metropolitan disability estimates ranged from 10.2% in Honolulu, Hawaii to 27.1% in Tucson, Ariz. Regional metropolitan medians for disability (range, 17.0-19.7%) were similar across the Northeast, Midwest, and South and were highest in the West. In the 20 metropolitan areas with the highest disability estimates, the prevalence of disability generally increased with age and was higher for women and those with a high-school education or less.
Conclusions: State and metropolitan-area estimates may be used to guide state and local efforts to prevent, delay, or reduce disability and secondary conditions in persons with disabilities.
Figures
References
-
- Waldrop J, Stern SM. Disability Status: 2000. Washington, DC: US Bureau of the Census; 2003. Report No. C2KBR-17. Available at: http://www.census.gov/prod/2003pubs/c2kbr-17.pdf. Accessed May 25, 2004.
-
- Centers for Disease Control and Prevention. Prevalence of disabilities and associated health conditions among adults—United States, 1999. MMWR Morb Mortal Wkly Rep. 2001;50:120–125. - PubMed
-
- Congressional Budget Office. Projections of Expenditures for Long-Term Care Services for the Elderly. Washington, DC: Congressional Budget Office; 1999. Available at: http://www.cbo.gov/ftpdoc.cfm?index=1123&type=1. Accessed May 25, 2004.
-
- Healthy People 2010: Understanding and Improving Health. Washington, DC: US Dept of Health and Human Services; 2000.
-
- Lollar DJ, Crews JE. Redefining the role of public health in disability. Annu Rev Public Health. 2003;24: 195–208. - PubMed
MeSH terms
LinkOut - more resources
Full Text Sources
Medical
