

Modulation of the immune response to the severe acute respiratory syndrome spike glycoprotein by gene-based and inactivated virus immunization
- PMID: 16254327
- PMCID: PMC1280202
- DOI: 10.1128/JVI.79.22.13915-13923.2005
Modulation of the immune response to the severe acute respiratory syndrome spike glycoprotein by gene-based and inactivated virus immunization
Abstract
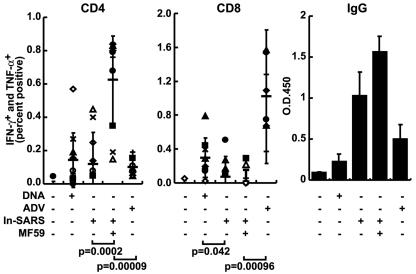
Although the initial isolates of the severe acute respiratory syndrome (SARS) coronavirus (CoV) are sensitive to neutralization by antibodies through their spike (S) glycoprotein, variants of S have since been identified that are resistant to such inhibition. Optimal vaccine strategies would therefore make use of additional determinants of immune recognition, either through cellular or expanded, cross-reactive humoral immunity. Here, the cellular and humoral immune responses elicited by different combinations of gene-based and inactivated viral particles with various adjuvants have been assessed. The T-cell response was altered by different prime-boost immunizations, with the optimal CD8 immunity induced by DNA priming and replication-defective adenoviral vector boosting. The humoral immune response was enhanced most effectively through the use of inactivated virus with adjuvants, either MF59 or alum, and was associated with stimulation of the CD4 but not the CD8 response. The use of inactivated SARS virus with MF59 enhanced the CD4 and antibody response even after gene-based vaccination. Because both cellular and humoral immune responses are generated by gene-based vaccination and inactivated viral boosting, this strategy may prove useful in the generation of SARS-CoV vaccines.
Figures


Similar articles
-
Induction of specific immune responses by severe acute respiratory syndrome coronavirus spike DNA vaccine with or without interleukin-2 immunization using different vaccination routes in mice.Clin Vaccine Immunol. 2007 Jul;14(7):894-901. doi: 10.1128/CVI.00019-07. Epub 2007 May 9. Clin Vaccine Immunol. 2007. PMID: 17494640 Free PMC article.
-
Priming with SARS CoV S DNA and boosting with SARS CoV S epitopes specific for CD4+ and CD8+ T cells promote cellular immune responses.Vaccine. 2007 Sep 28;25(39-40):6981-91. doi: 10.1016/j.vaccine.2007.06.047. Epub 2007 Jul 16. Vaccine. 2007. PMID: 17709158 Free PMC article.
-
Enhanced induction of SARS-CoV nucleocapsid protein-specific immune response using DNA vaccination followed by adenovirus boosting in BALB/c mice.Intervirology. 2006;49(5):307-18. doi: 10.1159/000094247. Epub 2006 Jun 29. Intervirology. 2006. PMID: 16809936 Free PMC article.
-
Severe acute respiratory syndrome vaccine development: experiences of vaccination against avian infectious bronchitis coronavirus.Avian Pathol. 2003 Dec;32(6):567-82. doi: 10.1080/03079450310001621198. Avian Pathol. 2003. PMID: 14676007 Free PMC article. Review.
-
Severe acute respiratory syndrome: vaccine on the way.Chin Med J (Engl). 2005 Sep 5;118(17):1468-76. Chin Med J (Engl). 2005. PMID: 16157050 Review. No abstract available.
Cited by
-
Evaluation of candidate vaccine approaches for MERS-CoV.Nat Commun. 2015 Jul 28;6:7712. doi: 10.1038/ncomms8712. Nat Commun. 2015. PMID: 26218507 Free PMC article.
-
Vaccination of calves using the BRSV nucleocapsid protein in a DNA prime-protein boost strategy stimulates cell-mediated immunity and protects the lungs against BRSV replication and pathology.Vaccine. 2008 Sep 2;26(37):4840-8. doi: 10.1016/j.vaccine.2008.06.100. Epub 2008 Jul 21. Vaccine. 2008. PMID: 18644416 Free PMC article.
-
Risk-benefit analysis on the clinical significance of convalescent plasma therapy in the management of COVID-19.Postgrad Med J. 2021 Jul;97(1149):467-468. doi: 10.1136/postgradmedj-2020-138056. Epub 2020 Aug 17. Postgrad Med J. 2021. PMID: 32817576 Free PMC article. No abstract available.
-
Vaccines for SARS-CoV-2: Lessons from Other Coronavirus Strains.Infect Dis Ther. 2020 Jun;9(2):255-274. doi: 10.1007/s40121-020-00300-x. Epub 2020 Apr 23. Infect Dis Ther. 2020. PMID: 32328406 Free PMC article. Review.
-
IRAK-M alters the polarity of macrophages to facilitate the survival of Mycobacterium tuberculosis.BMC Microbiol. 2017 Aug 23;17(1):185. doi: 10.1186/s12866-017-1095-2. BMC Microbiol. 2017. PMID: 28835201 Free PMC article.
References
-
- Al Mariri, A., A. Tibor, P. Mertens, X. De Bolle, P. Michel, J. Godefroid, K. Walravens, and J. J. Letesson. 2001. Protection of BALB/c mice against Brucella abortus 544 challenge by vaccination with bacterioferritin or P39 recombinant proteins with CpG oligodeoxynucleotides as adjuvant. Infect. Immun. 69:4816-4822. - PMC - PubMed
-
- Anonymous. 2004. Trial watch: SARS vaccine enters phase I trials. Expert Rev. Vaccines 3:386. - PubMed
-
- Balamurugan, V., R. M. Kumar, and V. V. Suryanarayana. 2004. Past and present vaccine development strategies for the control of foot-and-mouth disease. Acta Virol. 48:201-214. - PubMed
-
- Barouch, D. H., Z. Y. Yang, W. P. Kong, B. Korioth-Schmitz, S. M. Sumida, D. M. Truitt, M. G. Kishko, J. C. Arthur, A. Miura, J. R. Mascola, N. L. Letvin, and G. J. Nabel. 2005. A human T-cell leukemia virus type 1 regulatory element enhances the immunogenicity of human immunodeficiency virus type 1 DNA vaccines in mice and nonhuman primates. J. Virol. 79:8828-8834. - PMC - PubMed
-
- Basak, S. K., S. M. Kiertscher, A. Harui, and M. D. Roth. 2004. Modifying adenoviral vectors for use as gene-based cancer vaccines. Viral Immunol. 17:182-196. - PubMed
Publication types
MeSH terms
Substances
Grants and funding
LinkOut - more resources
Full Text Sources
Other Literature Sources
Research Materials
Miscellaneous
