. 2005 Nov;79(22):13993-4003.
doi: 10.1128/JVI.79.22.13993-14003.2005.

Epstein-Barr virus lytic infection contributes to lymphoproliferative disease in a SCID mouse model

Affiliations

Epstein-Barr virus lytic infection contributes to lymphoproliferative disease in a SCID mouse model

Gregory K Hong et al. J Virol. 2005 Nov.

Abstract

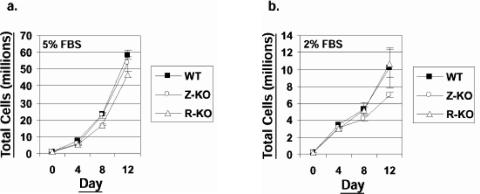
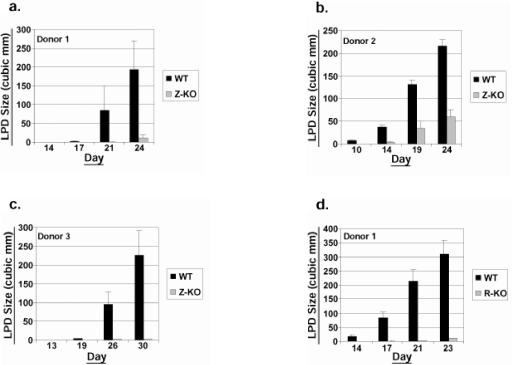
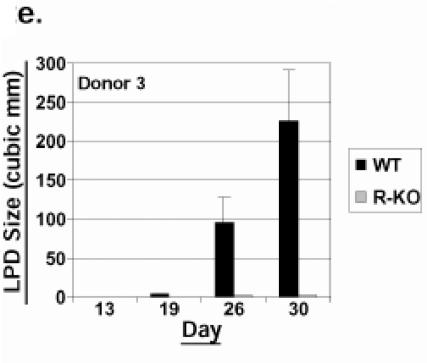
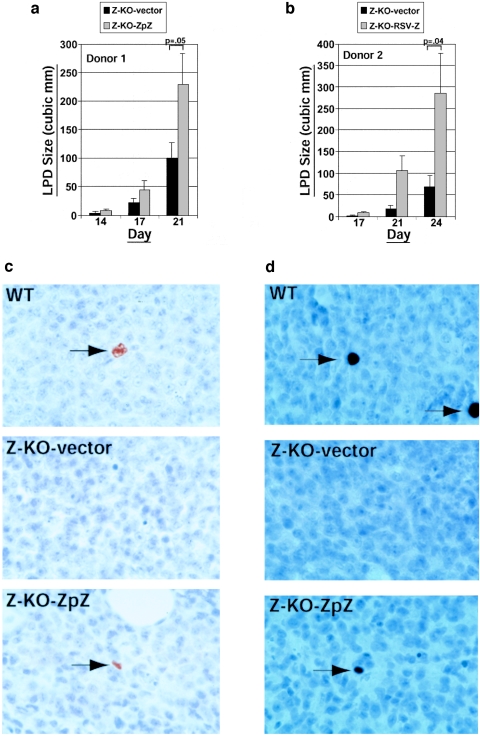
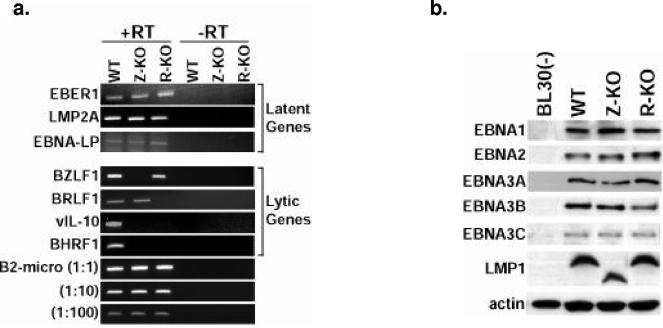
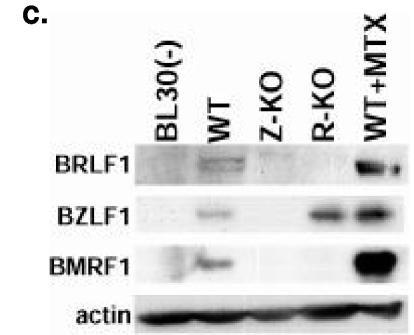
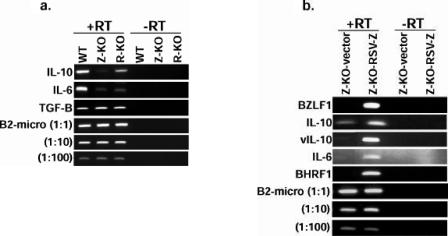
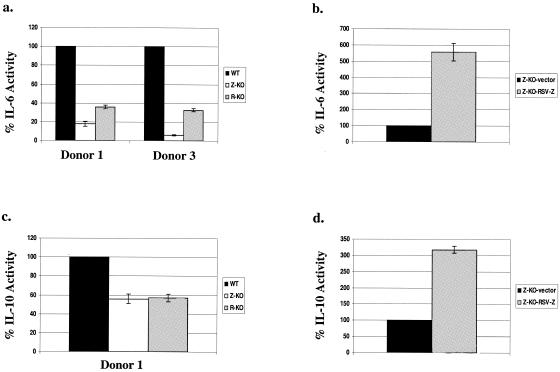
Most Epstein-Barr virus (EBV)-positive tumor cells contain one of the latent forms of viral infection. The role of lytic viral gene expression in EBV-associated malignancies is unknown. Here we show that EBV mutants that cannot undergo lytic viral replication are defective in promoting EBV-mediated lymphoproliferative disease (LPD). Early-passage lymphoblastoid cell lines (LCLs) derived from EBV mutants with a deletion of either viral immediate-early gene grew similarly to wild-type (WT) virus LCLs in vitro but were deficient in producing LPD when inoculated into SCID mice. Restoration of lytic EBV gene expression enhanced growth in SCID mice. Acyclovir, which prevents lytic viral replication but not expression of early lytic viral genes, did not inhibit the growth of WT LCLs in SCID mice. Early-passage LCLs derived from the lytic-defective viruses had substantially decreased expression of the cytokine interleukin-6 (IL-6), and restoration of lytic gene expression reversed this defect. Expression of cellular IL-10 and viral IL-10 was also diminished in lytic-defective LCLs. These results suggest that lytic EBV gene expression contributes to EBV-associated lymphoproliferative disease, potentially through induction of paracrine B-cell growth factors.


Figures

FIG. 1.
FIG. 1.
Z-KO and R-KO LCLs grow at a similar rate to WT LCLs in vitro. Early-passage WT, Z-KO, or R-KO LCLs were plated in medium containing either 5% (a) or 2% (b) FBS. Cells were counted every 4 days, and at each time point the cells were diluted back to 2 × 10⁵ cells/ml to maintain log phase growth. The experiment was done in duplicate with mean total cells plotted on the y axis; error bars indicate standard deviation. Similar results were obtained in samples from two different donors; one representative donor is shown.
FIG.2.
FIG.2.
Early-passage Z-KO and R-KO LCLs are impaired for growth in SCID mice. Early-passage WT, Z-KO, or R-KO LCLs were injected subcutaneously into the flanks of SCID mice, and LPD growth was monitored. y axis, mean LPD size in cubic millimeters; x axis, day postinjection. Error bars indicate standard error of the mean. (a) WT versus Z-KO LCL LPD growth (donor 1; eight injection sites per condition). (b) WT versus Z-KO LCL LPD growth (donor 2; eight injection sites per condition). (c) WT versus Z-KO LPD growth (donor 3; eight injection sites per WT condition and four injections sites per Z-KO condition). (d) WT versus R-KO LCL LPD growth (donor 1; eight injection sites per WT condition and four injection sites per R-KO condition). (e) WT versus R-KO LCL LPD growth (donor 3; eight injection sites per condition).
FIG.2.
FIG.2.
Early-passage Z-KO and R-KO LCLs are impaired for growth in SCID mice. Early-passage WT, Z-KO, or R-KO LCLs were injected subcutaneously into the flanks of SCID mice, and LPD growth was monitored. y axis, mean LPD size in cubic millimeters; x axis, day postinjection. Error bars indicate standard error of the mean. (a) WT versus Z-KO LCL LPD growth (donor 1; eight injection sites per condition). (b) WT versus Z-KO LCL LPD growth (donor 2; eight injection sites per condition). (c) WT versus Z-KO LPD growth (donor 3; eight injection sites per WT condition and four injections sites per Z-KO condition). (d) WT versus R-KO LCL LPD growth (donor 1; eight injection sites per WT condition and four injection sites per R-KO condition). (e) WT versus R-KO LCL LPD growth (donor 3; eight injection sites per condition).
FIG. 3.
FIG. 3.
BZLF1 expression rescues the in vivo defect of Z-KO LCLs in SCID mice. Z-KO LCLs carrying a control vector (Z-KO-vector) or a BZLF1 expression vector driven by the endogenous BZLF1 promoter (Z-KO-ZpZ) (a) or a BZLF1 expression vector driven by the RSV promoter (Z-KO-RSV-Z) (b) were injected subcutaneously into the flanks of SCID mice, and LPD growth was monitored over time. y axis, mean LPD size in cubic millimeters; x axis, day postinjection. Error bars indicate standard error of the mean. Data shown in panel a represent the mean of six injection sites per condition for Z-KO-vector and Z-KO-ZpZ LCLs from donor 1. Data shown in panel b represent the mean of eight injection sites per condition for Z-KO-vector and Z-KO-RSV-Z LCLs from donor 2. (c) BZLF1 immunohistochemistry of LPD harvested from WT LCL-injected mice (WT), Z-KO-vector LCL-injected mice (Z-KO-vector), or Z-KO-ZpZ LCL-injected mice (Z-KO-ZpZ). Arrows indicate positively staining cells. (d) BMRF1 immunohistochemistry of LPD harvested from WT LCL-injected mice (WT), Z-KO-vector LCL-injected mice (Z-KO-vector), or Z-KO-ZpZ LCL-injected mice (Z-KO-ZpZ). Arrows indicate positively staining cells.
FIG.4.
FIG.4.
Viral gene expression in Z-KO, R-KO, and WT LCLs. (a) Analysis of viral gene expression in Z-KO, R-KO, and WT LCLs growing in vitro using RT-PCR analysis. Similar results were obtained in samples from two different donors; one representative donor is shown. To account for potential contamination by genomic DNA in the PCR, control reactions containing RNA not transcribed with reverse transcriptase were included (−RT). Serial dilutions of the cDNAs were also subjected to PCR analysis using primers for B2-microglobulin (B2-micro) as a loading control. (b) Analysis of latent viral gene expression using immunoblot analysis of total protein from LCLs growing in vitro. BL30(−) is an EBV-negative Burkitt lymphoma line. (c) Analysis of lytic viral gene expression of total protein from LCLs growing in vitro. WT LCLs treated with the lytic inducing agent methotrexate (WT+MTX) were included as a positive control for lytic protein expression.
FIG.4.
FIG.4.
Viral gene expression in Z-KO, R-KO, and WT LCLs. (a) Analysis of viral gene expression in Z-KO, R-KO, and WT LCLs growing in vitro using RT-PCR analysis. Similar results were obtained in samples from two different donors; one representative donor is shown. To account for potential contamination by genomic DNA in the PCR, control reactions containing RNA not transcribed with reverse transcriptase were included (−RT). Serial dilutions of the cDNAs were also subjected to PCR analysis using primers for B2-microglobulin (B2-micro) as a loading control. (b) Analysis of latent viral gene expression using immunoblot analysis of total protein from LCLs growing in vitro. BL30(−) is an EBV-negative Burkitt lymphoma line. (c) Analysis of lytic viral gene expression of total protein from LCLs growing in vitro. WT LCLs treated with the lytic inducing agent methotrexate (WT+MTX) were included as a positive control for lytic protein expression.
FIG. 5.
FIG. 5.
Early-passage Z-KO and R-KO LCLs express lower levels of IL-6 and cIL-10 mRNA in vitro than the corresponding WT LCLs. (a) Total RNA from early-passage LCLs growing in vitro was subjected to RT-PCR analysis. Similar results were obtained in samples from two different donors; one representative donor is shown. −RT, no reverse transcriptase control. Serial dilutions of the cDNAs were also subjected to PCR analysis using primers for B2-microglobulin (B2-micro) as a loading control. (b) RT-PCR of RNA harvested from Z-KO LCLs carrying a control vector (Z-KO-vector) or a BZLF1-expression vector (Z-KO-RSV-Z).
FIG. 6.
FIG. 6.
Supernatants of early-passage Z-KO and R-KO LCLs have lower levels of IL-6 and cIL-10 in vitro than the corresponding WT LCLs. The amount of IL-6 and cIL-10 in the supernatants of early-passage LCLs growing in vitro was quantitated by ELISA as described in Materials and Methods. Similar results were obtained from the Z-KO LCLS in samples from three different donors; results from representative donors are shown. Similar results from the R-KO LCLs were obtained in two out of three donors as discussed in the text. (a) IL-6 levels in the supernatants of WT, Z-KO, and R-KO LCLS. Results are normalized such that the amount of IL-6 in each WT LCL supernatant is set at 100%. (b) IL-6 levels in the supernatants harvested from Z-KO LCLs carrying a control vector (Z-KO-vector) or a BZLF1-expression vector (Z-KO-RSV-Z). Results are normalized such that the amount of IL-6 in the supernatant of Z-KO LCLs carrying the control vector is set at 100%. (c) IL-10 levels in the supernatants of WT, Z-KO, and R-KO LCLS Results are normalized such that the amount of IL-10 in each WT LCL supernatant is set at 100%. (d) IL-10 levels in the supernatants harvested from Z-KO LCLs carrying a control vector (Z-KO-vector) or a BZLF1-expression vector (Z-KO-RSV-Z). Results are normalized such that the amount of IL-10 in the supernatant of Z-KO LCLs carrying the control vector is set at 100%.
FIG. 7.
FIG. 7.
Z-KO LCLs are more sensitive than WT LCLs to Fas-induced apoptosis in vitro. (a) Early-passage Z-KO, R-KO, or WT LCLs from two different donors were subjected to treatment with anti-Fas antibody for 48 h. Following treatment, cell viability was assessed as described in Materials and Methods. Data shown represent the mean of a representative experiment done in triplicate; error bars indicate standard deviation. (b) WT LCLs, Z-KO LCLs carrying a control vector (Z-KO-vector), and Z-KO LCLs carrying a BZLF1 expression vector (Z-KO-ZpZ) were subjected to anti-Fas treatment, followed by an assessment of viability. Data shown represent the mean of a representative experiment done in duplicate; error bars indicate standard deviation.

References

    1. Baiocchi, R. A., M. E. Ross, J. C. Tan, C. C. Chou, L. Sullivan, S. Haldar, M. Monne, M. V. Seiden, S. K. Narula, J. Sklar, et al. 1995. Lymphomagenesis in the SCID-hu mouse involves abundant production of human interleukin-10. Blood 85:1063-1074. - PubMed
    1. Bais, C., B. Santomasso, O. Coso, L. Arvanitakis, E. G. Raaka, J. S. Gutkind, A. S. Asch, E. Cesarman, M. C. Gershengorn, and E. A. Mesri. 1998. G-protein-coupled receptor of Kaposi's sarcoma-associated herpesvirus is a viral oncogene and angiogenesis activator. Nature 391:86-89. - PubMed
    1. Beatty, P. R., S. M. Krams, and O. M. Martinez. 1997. Involvement of IL-10 in the autonomous growth of EBV-transformed B cell lines. J. Immunol. 158:4045-4051. - PubMed
    1. Cayrol, C., and E. K. Flemington. 1995. Identification of cellular target genes of the Epstein-Barr virus transactivator Zta: activation of transforming growth factor beta igh3 (TGF-beta igh3) and TGF-beta 1. J. Virol. 69: 4206-4212. - PMC - PubMed
    1. Cordano, P., A. Lake, L. Shield, G. M. Taylor, F. E. Alexander, P. R. Taylor, J. White, and R. F. Jarrett. 2005. Effect of IL-6 promoter polymorphism on incidence and outcome in Hodgkin's lymphoma. Br. J. Haematol. 128: 493-495. - PubMed

Publication types

LinkOut - more resources