

Kinetics of cardiac thin-filament activation probed by fluorescence polarization of rhodamine-labeled troponin C in skinned guinea pig trabeculae
- PMID: 16258047
- PMCID: PMC1367058
- DOI: 10.1529/biophysj.105.072769
Kinetics of cardiac thin-filament activation probed by fluorescence polarization of rhodamine-labeled troponin C in skinned guinea pig trabeculae
Abstract
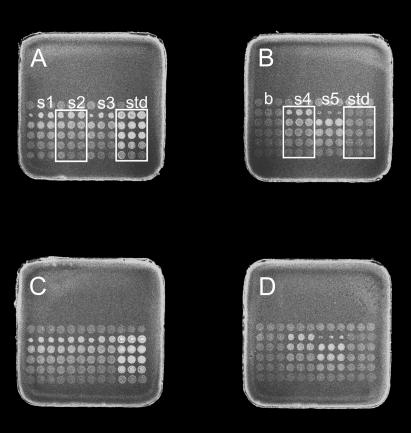
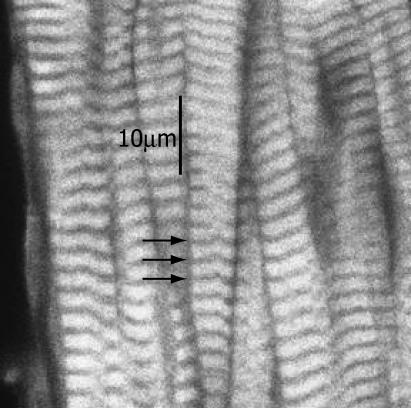
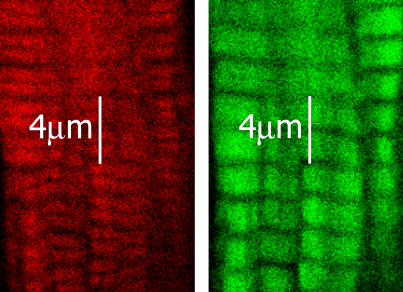
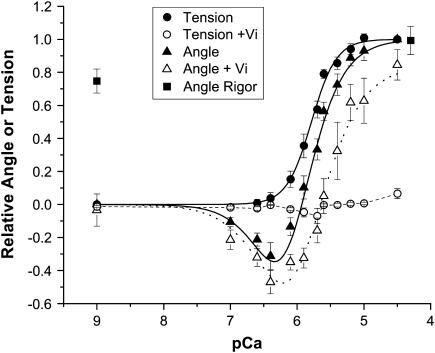
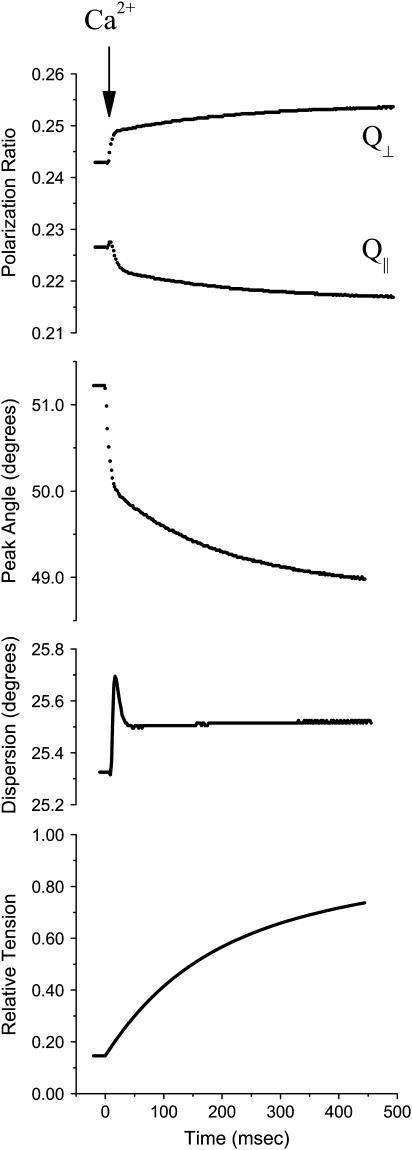
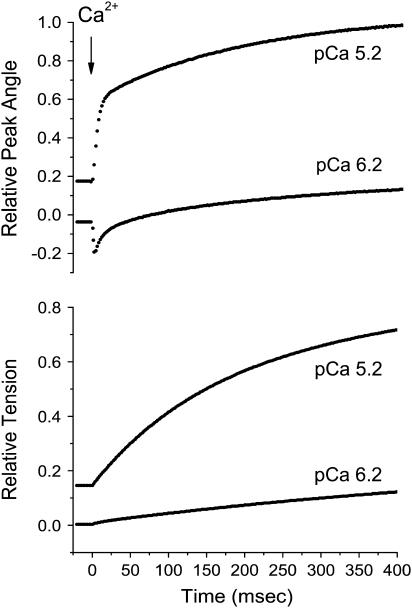
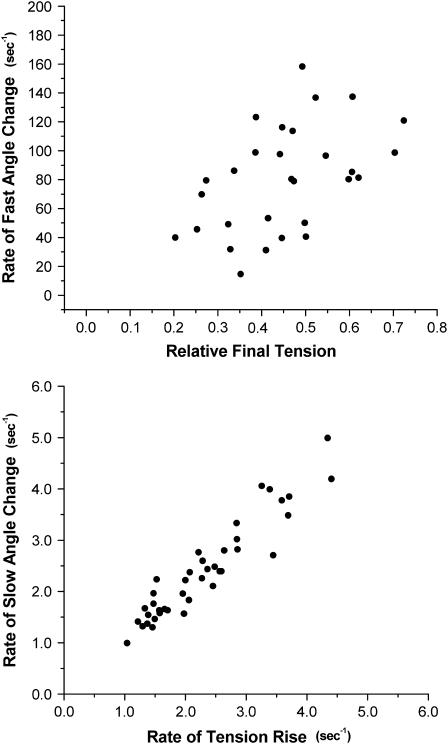
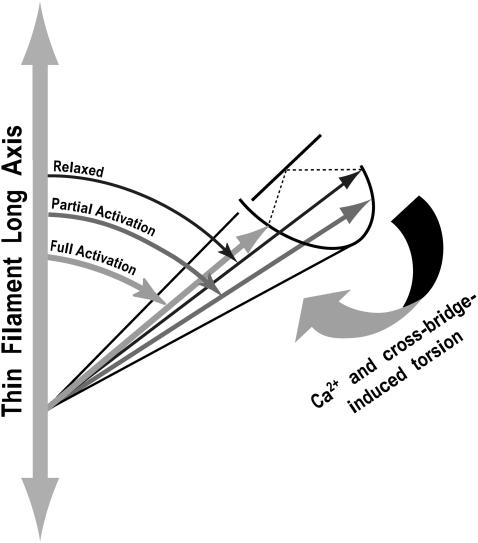
A genetically engineered cardiac TnC mutant labeled at Cys-84 with tetramethylrhodamine-5-iodoacetamide dihydroiodide was passively exchanged for the endogenous form in skinned guinea pig trabeculae. The extent of exchange averaged nearly 70%, quantified by protein microarray of individual trabeculae. The uniformity of its distribution was verified by confocal microscopy. Fluorescence polarization, giving probe angle and its dispersion relative to the fiber long axis, was monitored simultaneously with isometric tension. Probe angle reflects underlying cTnC orientation. In steady-state experiments, rigor cross-bridges and Ca2+ with vanadate to inhibit cross-bridge formation produce a similar change in probe orientation as that observed with cycling cross-bridges (no Vi). Changes in probe angle were found at [Ca2+] well below those required to generate tension. Cross-bridges increased the Ca2+ dependence of angle change (cooperativity). Strong cross-bridge formation enhanced Ca2+ sensitivity and was required for full change in probe position. At submaximal [Ca2+], the thin filament regulatory system may act in a coordinated fashion, with the probe orientation of Ca2+-bound cTnC significantly affected by Ca2+ binding at neighboring regulatory units. The time course of the probe angle change and tension after photolytic release [Ca2+] by laser photolysis of NP-EGTA was Ca2+ sensitive and biphasic: a rapid component approximately 10 times faster than that of tension and a slower rate similar to that of tension. The fast component likely represents steps closely associated with Ca2+ binding to site II of cTnC, whereas the slow component may arise from cross-bridge feedback. These results suggest that the thin filament activation rate does not limit the tension time course in cardiac muscle.
Figures
Similar articles
-
Ca2+ - and cross-bridge-dependent changes in N- and C-terminal structure of troponin C in rat cardiac muscle.Biophys J. 2001 Jan;80(1):360-70. doi: 10.1016/S0006-3495(01)76020-1. Biophys J. 2001. PMID: 11159408 Free PMC article.
-
Influence of length on force and activation-dependent changes in troponin c structure in skinned cardiac and fast skeletal muscle.Biophys J. 2001 Jun;80(6):2798-808. doi: 10.1016/S0006-3495(01)76247-9. Biophys J. 2001. PMID: 11371454 Free PMC article.
-
Effect of rigor and cycling cross-bridges on the structure of troponin C and on the Ca2+ affinity of the Ca2+-specific regulatory sites in skinned rabbit psoas fibers.J Biol Chem. 1987 Oct 5;262(28):13627-35. J Biol Chem. 1987. PMID: 3654633
-
Sarcomere mechanics in uniform and non-uniform cardiac muscle: a link between pump function and arrhythmias.Prog Biophys Mol Biol. 2008 Jun-Jul;97(2-3):312-31. doi: 10.1016/j.pbiomolbio.2008.02.013. Epub 2008 Feb 15. Prog Biophys Mol Biol. 2008. PMID: 18394686 Review.
-
Regulation of contraction in striated muscle.Physiol Rev. 2000 Apr;80(2):853-924. doi: 10.1152/physrev.2000.80.2.853. Physiol Rev. 2000. PMID: 10747208 Review.
Cited by
-
Cooperative cross-bridge activation of thin filaments contributes to the Frank-Starling mechanism in cardiac muscle.Biophys J. 2009 May 6;96(9):3692-702. doi: 10.1016/j.bpj.2009.02.018. Biophys J. 2009. PMID: 19413974 Free PMC article.
-
Calcium- and myosin-dependent changes in troponin structure during activation of heart muscle.J Physiol. 2009 Jan 15;587(1):155-63. doi: 10.1113/jphysiol.2008.164707. Epub 2008 Nov 17. J Physiol. 2009. PMID: 19015190 Free PMC article.
-
Insights into the kinetics of Ca2+-regulated contraction and relaxation from myofibril studies.Pflugers Arch. 2009 Jun;458(2):337-57. doi: 10.1007/s00424-008-0630-2. Epub 2009 Jan 23. Pflugers Arch. 2009. PMID: 19165498
-
Differences between cardiac and skeletal troponin interaction with the thin filament probed by troponin exchange in skeletal myofibrils.Biophys J. 2009 Jul 8;97(1):183-94. doi: 10.1016/j.bpj.2009.04.023. Biophys J. 2009. PMID: 19580756 Free PMC article.
-
Blebbistatin: use as inhibitor of muscle contraction.Pflugers Arch. 2008 Mar;455(6):995-1005. doi: 10.1007/s00424-007-0375-3. Epub 2007 Nov 10. Pflugers Arch. 2008. PMID: 17994251
References
-
- Lehrer, S. S., and E. P. Morris. 1982. Dual effects of tropomyosin and troponin-tropomyosin on actomyosin subfragment 1 ATPase. J. Biol. Chem. 257:8073–8080. - PubMed
-
- Craig, R., and W. Lehman. 2001. Crossbridge and tropomyosin positions observed in native, interacting thick and thin filaments. J. Mol. Biol. 311:1027–1036. - PubMed
-
- Vibert, P., R. Craig, and W. Lehman. 1997. Steric-model for activation of muscle thin filaments. J. Mol. Biol. 266:8–14. - PubMed
-
- Hofmann, P. A., and F. Fuchs. 1987. Evidence for a force-development component of calcium binding to cardiac troponin C. Am. J. Physiol. 253:C541–C546. - PubMed
MeSH terms
Substances
Grants and funding
LinkOut - more resources
Full Text Sources
Miscellaneous
