

Isolating gene-corrected stem cells without drug selection
- PMID: 16258059
- PMCID: PMC1274242
- DOI: 10.1073/pnas.0508263102
Isolating gene-corrected stem cells without drug selection
Abstract
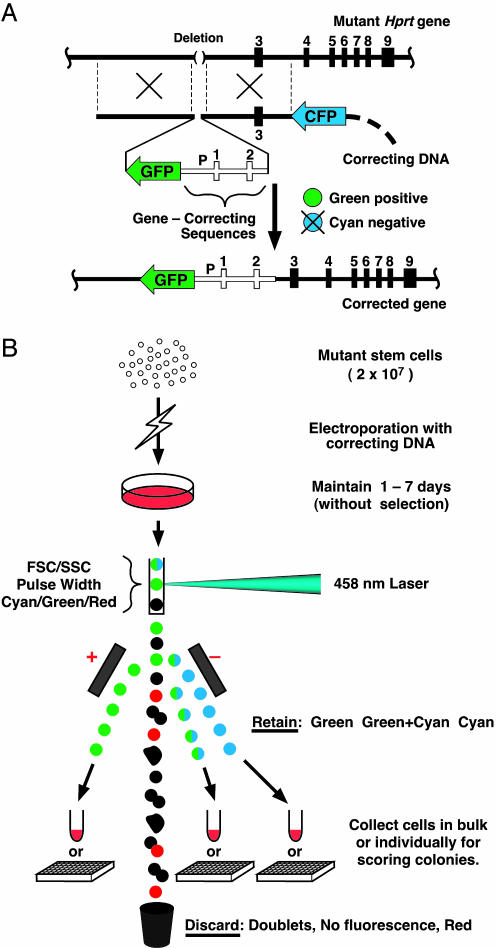
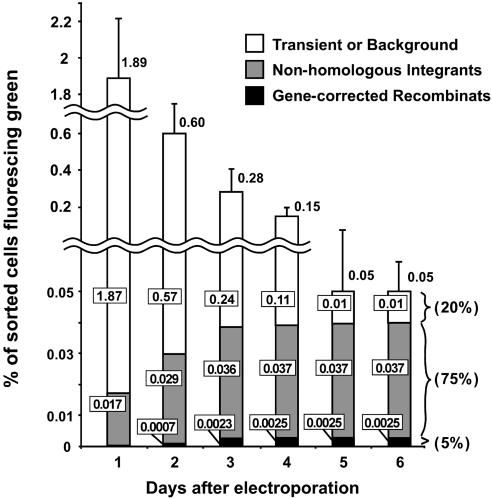
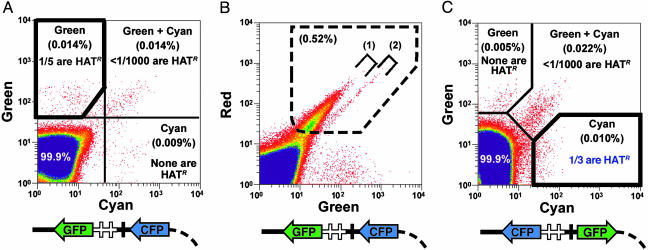
Progress in isolating stem cells from tissues, or generating them from adult cells by nuclear transfer, encourages attempts to use stem cells from affected individuals for gene correction and autologous therapy. Current viral vectors are efficient at introducing transgenic sequences but result in random integrations. Gene targeting, in contrast, can directly correct an affected gene, or incorporate corrective sequences into a site free from undesirable side effects, but efficiency is low. Most current targeting procedures, consequently, use positive-negative selection with drugs, often requiring >/=10 days. This drug selection causes problems with stem cells that differentiate in this time or require feeder cells, because the feeders must be drug resistant and so are not eliminated by the selection. To overcome these problems, we have developed a procedure for isolating gene-corrected stem cells free from feeder cells after 3-5 days culture without drugs. The method is still positive-negative, but the positive and negative drug-resistance genes are replaced with differently colored fluorescence genes. Gene-corrected cells are isolated by FACS. We tested the method with mouse ES cells having a mutant hypoxanthine phosphoribosyltransferase (Hprt) gene and grown on feeder cells. After 5 days in culture, gene-corrected cells were obtained free from feeder cells at a "purity" of >30%, enriched >2,000-fold and with a recovery of approximately 20%. Corrected cells were also isolated singly for clonal expansion. Our FACS-based procedure should be applicable at small or large scale to stem cells that can be cultured (with feeder cells, if necessary) for >/=3 days.
Figures
Similar articles
-
Efficient gene targeting in mouse embryonic stem cells.Gene Ther. 1997 Jul;4(7):700-9. doi: 10.1038/sj.gt.3300457. Gene Ther. 1997. PMID: 9282171
-
Labeling embryonic stem cells with enhanced green fluorescent protein on the hypoxanthineguanine phosphoribosyl transferase locus.Chin Med J (Engl). 2003 Feb;116(2):267-72. Chin Med J (Engl). 2003. PMID: 12775245
-
Tissue-specific expression of a BAC transgene targeted to the Hprt locus in mouse embryonic stem cells.Genomics. 2004 Jun;83(6):1072-82. doi: 10.1016/j.ygeno.2003.12.015. Genomics. 2004. PMID: 15177560
-
Introduction of a subtle mutation into the Hox-2.6 locus in embryonic stem cells.Nature. 1991 Mar 21;350(6315):243-6. doi: 10.1038/350243a0. Nature. 1991. PMID: 1672446
-
Prospective characterization of neural stem cells by flow cytometry analysis using a combination of surface markers.J Neurosci Res. 2005 May 15;80(4):456-66. doi: 10.1002/jnr.20442. J Neurosci Res. 2005. PMID: 15795928
Cited by
-
Therapeutic benefits in thalassemic mice transplanted with long-term-cultured bone marrow cells.Exp Hematol. 2011 Mar;39(3):375-83, 383.e1-4. doi: 10.1016/j.exphem.2010.12.007. Epub 2010 Dec 22. Exp Hematol. 2011. PMID: 21184801 Free PMC article.
-
Low-Dose Irradiation Enhances Gene Targeting in Human Pluripotent Stem Cells.Stem Cells Transl Med. 2015 Sep;4(9):998-1010. doi: 10.5966/sctm.2015-0050. Epub 2015 Jul 16. Stem Cells Transl Med. 2015. PMID: 26185257 Free PMC article.
-
Microhomology-assisted scarless genome editing in human iPSCs.Nat Commun. 2018 Mar 5;9(1):939. doi: 10.1038/s41467-018-03044-y. Nat Commun. 2018. PMID: 29507284 Free PMC article.
-
A rapid FACS-based strategy to isolate human gene knockin and knockout clones.PLoS One. 2012;7(2):e32646. doi: 10.1371/journal.pone.0032646. Epub 2012 Feb 29. PLoS One. 2012. PMID: 22393430 Free PMC article.
-
Sorting and expansion of murine embryonic stem cell colonies using micropallet arrays.Cytometry A. 2009 Feb;75(2):121-9. doi: 10.1002/cyto.a.20672. Cytometry A. 2009. PMID: 19012319 Free PMC article.
References
-
- Shizuru, J. A., Negrin, R. S. & Weissman, I. L. (2005) Annu. Rev. Med. 56, 509-538. - PubMed
-
- Sauvageau, G., Iscove, N. N. & Humphries, R. K. (2004) Oncogene 23, 7223-7232. - PubMed
-
- Bunting, K. D., Galipeau, J., Topham, D., Benaim, E. & Sorrentino, B. P. (1998) Blood 92, 2269-2279. - PubMed
-
- Antonchuk, J., Sauvageau, G. & Humphries, R. K. (2002) Cell 109, 39-45. - PubMed
Publication types
MeSH terms
Substances
Grants and funding
LinkOut - more resources
Full Text Sources
Other Literature Sources
Medical
Miscellaneous
