. 2005 Nov 8;102(45):16339-44.
doi: 10.1073/pnas.0502598102. Epub 2005 Oct 28.

Helicobacter pylori CagA induces a transition from polarized to invasive phenotypes in MDCK cells

Affiliations

Helicobacter pylori CagA induces a transition from polarized to invasive phenotypes in MDCK cells

Fabio Bagnoli et al. Proc Natl Acad Sci U S A. .

Abstract

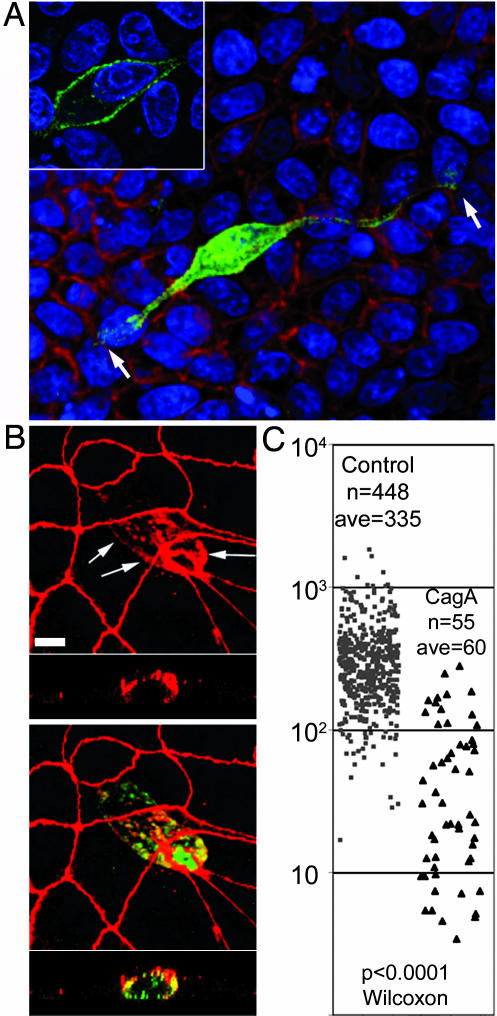
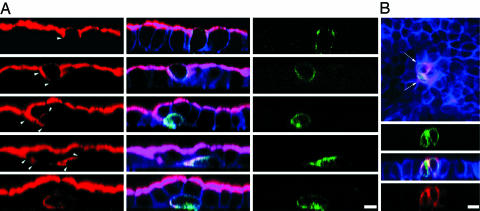
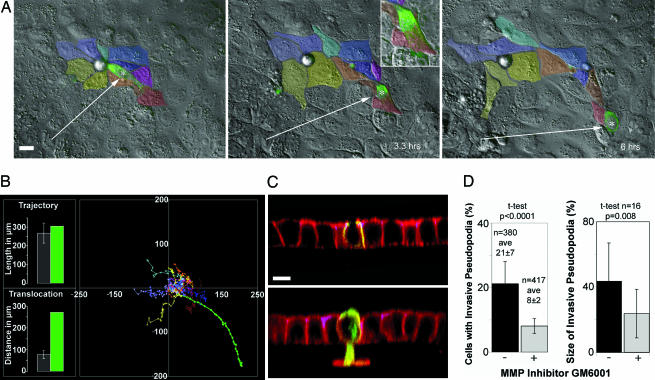
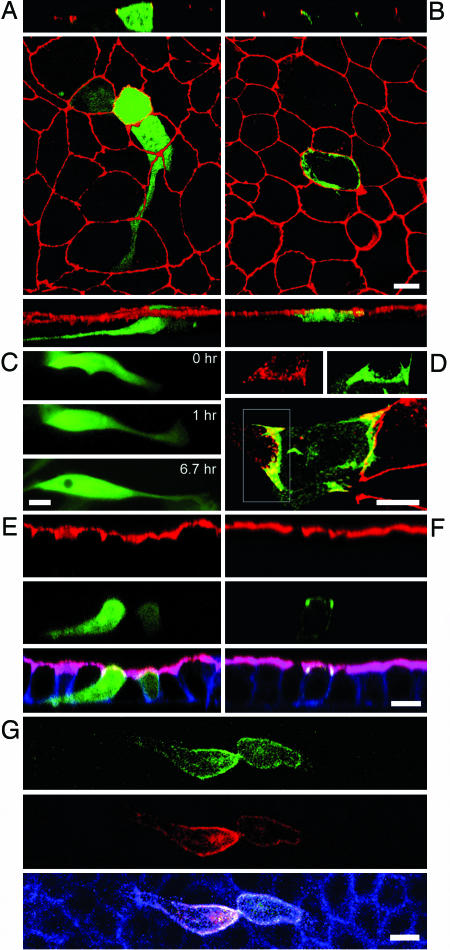
CagA is a bacterial effector protein of Helicobacter pylori that is translocated via a type IV secretion system into gastric epithelial cells. We previously described that H. pylori require CagA to disrupt the organization and assembly of apical junctions in polarized epithelial cells. In this study, we provide evidence that CagA expression is not only sufficient to disrupt the apical junctions but also perturbs epithelial differentiation. CagA-expressing cells lose apicobasal polarity and cell-cell adhesion, extend migratory pseudopodia, and degrade basement membranes, acquiring an invasive phenotype. Expression of the CagA C-terminal domain, which contains the tyrosine phosphorylated EPIYA motifs, induces pseudopodial activity but is not sufficient to induce cell migration. Conversely, the N terminus targets CagA to the cell-cell junctions. Neither domain is sufficient to disrupt cell adhesion or cell polarity, but coexpressed in trans, the N terminus determines the localization of both polypeptides. We show that CagA induces a morphogenetic program in polarized Madin-Darby canine kidney cells resembling an epithelial-to-mesenchymal transition. We propose that altered cell-cell and cell matrix interactions may serve as an early event in H. pylori-induced carcinogenesis.


Figures

Fig. 1.
Fig. 1.
CagA perturbs the morphology and apical junctions of polarized epithelia. (A and B) Confocal immunofluorescence 3D reconstructions of confluent MDCK monolayers expressing GFP-CagA (green) for 24 h. (A) Cells were counterstained for F-actin (red) and the cell nuclei (blue). Shown is an xy view seen from the bottom of the monolayer with one elongated CagA-expressing cell (green), spanning about nine cell diameters (arrows). (Inset) Optical section through the cell body of the CagA-expressing cell to show the subcellular localization of the protein. (B) CagA-expressing cells (green) stained for the tight junction protein ZO-1 (red) show mislocalization of ZO-1 to the basolateral membrane (arrows). Note also the reduced perimeter of the apical junctions in the CagA-expressing cell. The bottom strips are z sections. (C) The apical surface areas of control (gray squares) vs. CagA-expressing (black triangles) cells are plotted as a scatter plot. n, number of cells measured; ave, average cell surface area. The P values derived from a Wilcoxon nonparametric statistical test are noted. (Scale bars: 10 μm.)
Fig. 2.
Fig. 2.
CagA causes loss of apicobasal polarity and opens the tight junctions. Confocal 3D reconstructions of MDCK monolayers polarized on Transwell filters, then transfected to express GFP-CagA (green), and stained for F-actin (blue). (A) Monolayers were stained for the apical membrane glycoprotein gp135 (red). Arrowheads show mislocalization of gp135 in the basolateral membrane as cells lose apicobasal polarity. Note also different stages in the loss of connection to the apical surface. (B) Polarized MDCK monolayer expressing GFP-CagA (green) was fixed without permeabilization and stained from the apical side with an antibody to the extracellular domain of E-cadherin (red). Arrows point to E-cadherin exposed on the apical surface of GFP-CagA-expressing cells. z sections show that anti-E-cadherin antibodies reach the paracellular space of GFP-CagA-expressing cells. (Scale bars: 10 μm.)
Fig. 3.
Fig. 3.
CagA-expressing cells acquire a migratory and invasive phenotype. (A) Differential interference contrast microscopy (DIC) and fluorescence images of three frames from a 6-h time-lapse movie (see Movies 1 and 2) where the movement of a GFP-CagA-expressing cell (asterisk) and its contacting neighboring cells (color-coded) was followed. The CagA-expressing cell migrates from its original position and loses contact with most of the neighboring cells. (B) Graph of the trajectories of control cells color-coded in A and the CagA-expressing cell (green plot). The average trajectory length and translocation distances were compared between the control cells (gray bars) and the GFP-CagA-expressing cell (green bars) in the bar graphs. Error bars are one standard deviation from the mean. (C) Cells polarized on Matrigel-coated filters were transfected to express different CagA-GFP fusions (green), stained for F-actin (red), and imaged by confocal microscopy. (C Upper) z section of a monolayer expressing GFP-NT-CagA. These cells do not invade through the Matrigel. (C Lower) GFP-CagA-expressing cell with a large actin-rich pseudopodium that invades the basement membrane and crosses the filter. (D) GFP-CagA-expressing cells were imaged and invasive processes counted and measured volumetrically in the presence or absence of an MMP inhibitor. The percentage of cells with invasive pseudopodia and the percentage of actin signal below the basement membrane were calculated and plotted. Error bars represent one standard deviation from the mean. n, number of cells counted or measured; ave, averages. The P values derived from t tests are displayed. (Scale bars: 10 μm.)
Fig. 4.
Fig. 4.
Differential localization and functional activity of CagA subdomains. Confocal immunofluorescence 3D reconstructions of GFP-CT-CagA (A) or GFP-NT-CagA-expressing (B) cells within confluent MDCK monolayers stained for ZO-1 (red). CagA-GFP fusions are green. (A and B Top) z sections. (Bottom) 3D reconstructed side views. (C) Three panels from a 6.7-h time-lapse movie show a cell expressing GFP-CT-CagA within a confluent monolayer. Extension of a long basal pseudopodium is observed, but the cell does not migrate. (D) A subconfluent MDCK monolayer expressing GFP-NT-CagA was stained with anti-ZO-1 antibodies to show the distribution of NT-CagA at areas of junction formation (yellow). (Inset) Area of a forming junction with separate ZO-1 (red) and GFP-NT-CagA (green) signals. (E and F) Neither the N- nor C-terminal portions of CagA are sufficient to disrupt apicobasal polarity. Shown are confocal z sections of MDCK monolayers expressing GFP-CT-CagA (E) and GFP-NT-CagA (F). Cells were stained for F-actin (blue) and an antibody to gp135 (red). (G) Coexpression of the two CagA fragments reveals a molecular interaction between the two domains. The NT-CagA fragment was tagged with red fluorescent protein (red) and coexpressed with GFP-CT-CagA (green) in a confluent monolayer. The cells were also stained for F-actin (blue). (Scale bars: 10 μm.)

References

    1. Amieva, M. R., Vogelmann, R., Covacci, A., Tompkins, L. S., Nelson, W. J. & Falkow, S. (2003) Science 300, 1430-1434. - PMC - PubMed
    1. Segal, E. D., Cha, J., Lo, J., Falkow, S. & Tompkins, L. S. (1999) Proc. Natl. Acad. Sci. USA 96, 14559-14564. - PMC - PubMed
    1. Asahi, M., Azuma, T., Ito, S., Ito, Y., Suto, H., Nagai, Y., Tsubokawa, M., Tohyama, Y., Maeda, S., Omata, M., et al. (2000) J. Exp. Med. 191, 593-602. - PMC - PubMed
    1. Backert, S., Ziska, E., Brinkmann, V., Zimny-Arndt, U., Fauconnier, A., Jungblut, P. R., Naumann, M. & Meyer, T. F. (2000) Cell. Microbiol. 2, 155-164. - PubMed
    1. Odenbreit, S., Puls, J., Sedlmaier, B., Gerland, E., Fischer, W. & Haas, R. (2000) Science 287, 1497-1500. - PubMed

Publication types

Substances