. 2005 Nov;7(5):613-22.
doi: 10.1016/S1525-1578(10)60595-8.

Simultaneous detection and quantification of mitochondrial DNA deletion(s), depletion, and over-replication in patients with mitochondrial disease

Affiliations

Simultaneous detection and quantification of mitochondrial DNA deletion(s), depletion, and over-replication in patients with mitochondrial disease

Ren-Kui Bai et al. J Mol Diagn. 2005 Nov.

Abstract

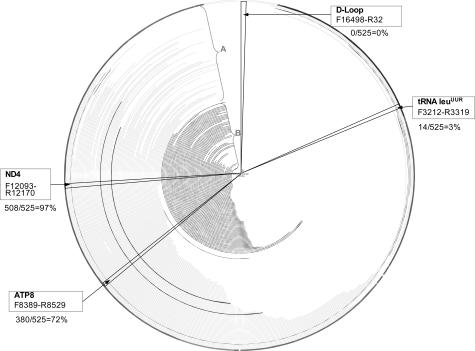
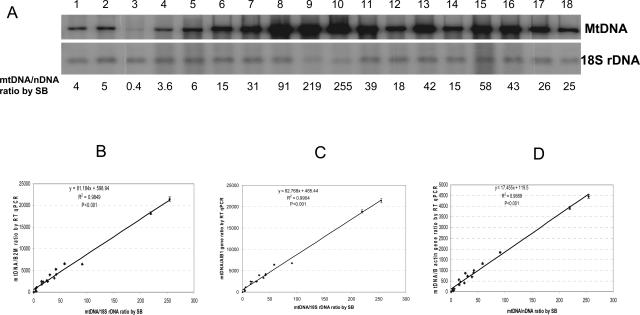
Heterogeneous clinical expression of mitochondrial DNA (mtDNA) disorders depends on both qualitative and quantitative changes in mtDNA. We developed a sensitive and effective method that simultaneously detects mtDNA deletion(s) and quantifies total mtDNA content. The percentage of deletions and mtDNA content of 19 patients with single or multiple deletions were analyzed by real-time quantitative polymerase chain reaction (real-time qPCR) using TaqMan probes specific for mtDNA (tRNA leu(UUR), ND4, ATPase8, and D-loop regions) and nuclear DNA (AIB1, beta-2-microglobulin, and beta-actin). The proportion of deletion mutants determined by real-time qPCR was consistent with that determined by Southern analysis. Most patients with mtDNA deletions also demonstrated compensatory mtDNA over-replication. Multiple mtDNA deletions that were not detectable by Southern analysis due to low percentage of each deletion molecule were readily detected and quantified by real-time qPCR. Furthermore, 12 patients with clinical features and abnormal biochemical/histopathological results consistent with mitochondrial respiratory chain disorders without identified mtDNA mutations had either substantially depleted or significantly over-replicated mtDNA content, supporting the diagnosis of mitochondrial disease. Our results demonstrate that both qualitative and quantitative analyses are important in molecular diagnosis of mitochondrial diseases. The presence of deletion(s) and mtDNA depletion or compensatory over-replication can be determined simultaneously by real-time qPCR.


Figures

Figure 1
Figure 1
Location of mtDNA probes for the real-time qPCR analysis of mtDNA deletion and depletion. The first nucleotide is at the 12 o’clock position. Clockwise are tRNA leuUUR, ATP8, ND4, and D-Loop. The arcs in the circle represent the deleted regions in reported cases, from the starting nucleotide position (np) of the deletion to the ending np of the deletion, based on mitomap database (http://www.mitomap.org, accessed on March 8, 2003). A: Reported large-scale [≥264 bp] single deletions. B: Reported multiple deletions. The two bolded arcs in A represent the two most common large-scale single deletions reported.
Figure 2
Figure 2
The heteroplasmic mtDNA deletions determined by Southern analysis and real-time qPCR. A:Southern blot analysis. The number on the top is patient’s number. The number at the bottom is the percentage of deletion molecules. The percentage of deletion heteroplasmy is the intensity of mtDNA with deletion (bottom band) divided by the sum of the intensity of mtDNA with deletion and the intact mtDNA (top band). The intensity of the DNA bands is measured using Scion Image for Windows (β 4.02) software (http://www.scioncorp.com). B: The correlation between the percentages of deletion mutant measured by real-time qPCR and Southern blot. The calculation of percent of mtDNA deletion by real-time qPCR was described in the footnote of Table 2. Only the data points from the deleted region(s) were included in the plot: ATP8 (9 filled circles) and ND4 (12 open circles). Patient 21 in Table 2, which has multiple deletions, was not included in the plot. The linear regression analysis was performed using SigmaStat for Windows Version 2.03, and the graph was plotted using SigmaPlot 2000 for Windows Version 6.00. The P value is <0.001.
Figure 3
Figure 3
Detection of mtDNA multiple deletions by Southern analysis (A) and PCR (B). Lanes 1 to 6 are normal control and patients 101 to 105, respectively. Lane 7 in B is no template control in PCR. A: Southern blot analysis. Total DNA was digested with HindIII followed by electrophoresis in 0.8% agarose gel and Southern analysis. The blot was hybridized with mtDNA probes (see Materials and Methods). B: PCR using primers mtF7234-R16133 (I), mtF8295-14499 (II), and mtF5681-R14686 (III). M, 100-bp DNA marker.
Figure 4
Figure 4
Measurement of mtDNA content. A: Southern analysis. The upper blot was hybridized with mtDNA probe, and the lower blot was hybridized with 18S rDNA probe. The numbers on the top (1 to 18) are DNA samples from patients 201 to 218, respectively. The numbers at the bottom are ratios of signal intensities of mtDNA to 18S rDNA. Total muscle DNA (0.15 μg) was digested with EagI followed by Southern analysis. B through D: MtDNA content determined by real-time qPCR using β2M (B), AIB1(C), or β-actin gene (D) as nuclear gene reference and their correlation with the mtDNA content determined by Southern blot analysis using 18S rDNA as the reference nuclear gene. mtDNA is the mean of copy number of mtDNA from tRNA leuUUR and D-loop region determined by standard curves.

References

    1. Anderson S, Bankier AT, Barrell BG, de Bruijn MH, Coulson AR, Drouin J, Eperon IC, Nierlich DP, Roe BA, Sanger F, Schreier PH, Smith AJ, Staden R, Young IG. Sequence and organization of the human mitochondrial genome. Nature. 1981;290:457–465. - PubMed
    1. Shoffner JM, Wallace DC. Oxidative phosphorylation diseases. Scriver CR, Beaudet AL, Sly WS, Valle D, editors. New York: McGraw-Hill,; The Metabolic and Molecular Bases of Inherited Disease. 1995:1535–1629.
    1. Wallace DC. Disease of mitochondrial DNA. Annu Rev Biochem. 1992;61:1175–1212. - PubMed
    1. Servidei S. Mitochondrial encephalomyopathies: gene mutation. Neuromusc Disord. 2003;13:685–690. - PubMed
    1. Wong L-JC, Liang M-H, Kwon H, Bai RK, Alper O, Gropman A. A CF patient with two novel mutations in mitochondrial DNA: mild disease led to delayed diagnosis of both disorders. Am J Med Genet. 2002;113:59–64. - PubMed

Publication types

MeSH terms