. 2005 Nov 8;102(45):16448-53.
doi: 10.1073/pnas.0505427102. Epub 2005 Oct 31.

Brain lactate kinetics: Modeling evidence for neuronal lactate uptake upon activation

Affiliations

Brain lactate kinetics: Modeling evidence for neuronal lactate uptake upon activation

Agnès Aubert et al. Proc Natl Acad Sci U S A. .

Abstract

A critical issue in brain energy metabolism is whether lactate produced within the brain by astrocytes is taken up and metabolized by neurons upon activation. Although there is ample evidence that neurons can efficiently use lactate as an energy substrate, at least in vitro, few experimental data exist to indicate that it is indeed the case in vivo. To address this question, we used a modeling approach to determine which mechanisms are necessary to explain typical brain lactate kinetics observed upon activation. On the basis of a previously validated model that takes into account the compartmentalization of energy metabolism, we developed a mathematical model of brain lactate kinetics, which was applied to published data describing the changes in extracellular lactate levels upon activation. Results show that the initial dip in the extracellular lactate concentration observed at the onset of stimulation can only be satisfactorily explained by a rapid uptake within an intraparenchymal cellular compartment. In contrast, neither blood flow increase, nor extracellular pH variation can be major causes of the lactate initial dip, whereas tissue lactate diffusion only tends to reduce its amplitude. The kinetic properties of monocarboxylate transporter isoforms strongly suggest that neurons represent the most likely compartment for activation-induced lactate uptake and that neuronal lactate utilization occurring early after activation onset is responsible for the initial dip in brain lactate levels observed in both animals and humans.


Figures

Fig. 1.
Fig. 1.
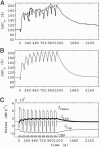
Changes of extracellular lactate concentration on a single stimulation. (A) Experimental data. Extracellular lactate concentration, measured by Hu and Wilson (10) in rat brain hippocampus, after a 5-s electrical stimulation of the perforant pathway. [Reproduced with permission from ref. (Copyright 1997, Blackwell, Oxford).] (B) Typical simulation of extracellular lactate (LACe) changes as a function of time in the case of a sustained activation with a 70-s blood flow (CBF) increase. According to hypothesis J1, because of the cellular contribution J(t), JTissue first decreases for 0 < t < 18 s, then increases for 18 s < t < 70 s. (C) Simulated rates. Temporal evolution of JTissue, JBBB, and JCap. LACe is expressed as percent of LACe,0, the basal extracellular lactate concentration. Parameter values (14, 18, 19, 22) are Ve = 0.2, Vc = 0.0055, β = 0.001 s-1, J0 = 0.001 mM·s-1, Tmax = 0.0061 mM·s-1, Kt = 3.5 mM (hypothesis H1), CBF0 = 0.01 s-1, and LACa = 0.3 mM, so that at steady-state values for lactate are LACe = 1.19 mM, LACc = 0.35 mM. Stimulation parameter values are αF = 0.8, tF = 5s, αJi = -0.8, ti = 18 s, αJ = 4.73, tJ = 5s, and tend = 70 s.
Fig. 2.
Fig. 2.
Changes of extracellular lactate concentration on repetitive stimulation. (A) Experimental data. Measured variation in extracellular lactate concentration, obtained by Hu and Wilson (10) in rat brain hippocampus, during a sequence of 5-s electrical stimulations of the perforant pathway with 2-min rest intervals. [Reproduced with permission from ref. (Copyright 1997, Blackwell, Oxford).] (B) Typical simulation of extracellular lactate (LACe) changes as a function of time in the case of a repetitive activation. All parameters are the same as in Fig. 1, except that αJi = -1.5 and αJ = 3.85, to match the amplitude of the first initial dip reported by Hu and Wilson (10). (C) Simulated rates. Note the time evolution of the initial dip of JTissue.
Fig. 3.
Fig. 3.
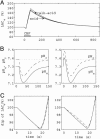
Effect of pH variations on lactate levels. (A) Effect of pH variation on LACe time course in the case of a unique activation (hypothesis H2). The effect of extracellular and capillary H+ ion concentrations on blood-brain transport of lactate are taken into account by using Eq. 6 instead of Eq. 5. Parameter values are KH = 3.5 × 10-4.3 mM2, pHe,0 = 7.3, and pHc,0 = 7.38. Stimulation parameters are A1 = 0.164, A2 = 0.114, A3 = 0.025, τ1 = 10.7 s, τ2 = 15.4 s, τ3 = 21 s, and td = 12.75 s. All other parameter values are the same as in Fig. 1. (B) Extracellular and capillary pH time courses (pHe and pHc). (Left) Acid case: pHe undergoes an acidification (17), whereas pHc either decreases (dashed line) or remains constant (dotted line). (Right) Alk-acid case: pHe undergoes an alkalinization followed by an acidification (16, 17), whereas pHc either follows pHe evolution (dashed line) or remains constant (dotted line). (C) Corresponding time evolution of extracellular lactate, in the acid case (Left) and the alk-acid case (Right). Solid line indicates no pH variation (hypothesis H1); dashed line indicates that both pHe and pHc vary, according to B Left or B Right, respectively; dotted line indicates only pHe varies, according to B Left or B Right, respectively.
Fig. 4.
Fig. 4.
The ratio between the transmembrane flux of lactate via MCTs (Jmb) and the maximal transport rate through the cell membrane (Tmax,ie) as a function of the intracellular lactate concentration (LACi), in two cases: (i) Kt = 0.7 mM for neurons (thin solid line), and (ii) Kt = 3.5 mM for astrocytes (thick solid line). Lactate transport via MCTs through cellular membrane is defined by Eq. 11. Other parameter values are LACe = 1.19 mM, H+i = 10-4.1 mM, H+e = 10-4.3 mM (which corresponds to an equilibrium value of 0.75 mM for intracellular lactate).

References

    1. Siesjö, B. K. (1978) Brain Energy Metabolism (Wiley, New York).
    1. Fox, P. T. & Raichle, M. E. (1986) Proc. Natl. Acad. Sci. USA 83, 1140-1144. - PMC - PubMed
    1. Prichard, J., Rothman, D., Novotny, E., Petroff, O., Kuwabara, T., Avison, M., Howseman, A., Hanstock, C. & Shulman, R. (1991) Proc. Natl. Acad. Sci. USA 88, 5829-5831. - PMC - PubMed
    1. Sappey-Marinier, D., Calabrese, G., Fein, G., Hugg, J. W., Biggins, C. & Weiner, M. W. (1992) J. Cereb. Blood Flow Metab. 12, 584-592. - PubMed
    1. Frahm, J., Krüger, G., Merboldt, K.-D. & Kleinschmidt, A. (1996) Magn. Reson. Med. 35, 143-148. - PubMed

Publication types

LinkOut - more resources