. 2005 Nov 8;102(45):16203-8.
doi: 10.1073/pnas.0508257102. Epub 2005 Oct 31.

Long-range protein electron transfer observed at the single-molecule level: In situ mapping of redox-gated tunneling resonance

Affiliations

Long-range protein electron transfer observed at the single-molecule level: In situ mapping of redox-gated tunneling resonance

Qijin Chi et al. Proc Natl Acad Sci U S A. .

Abstract

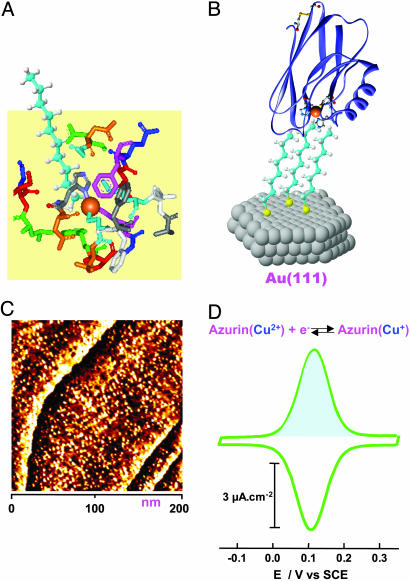
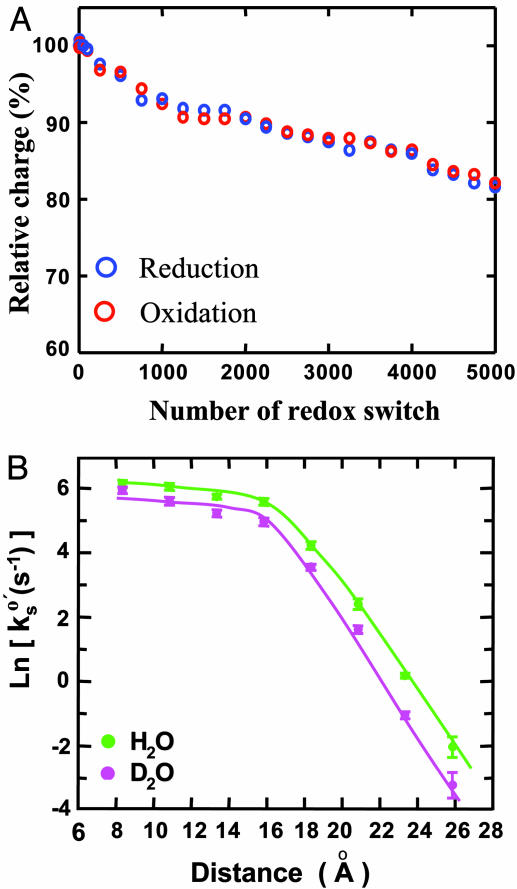
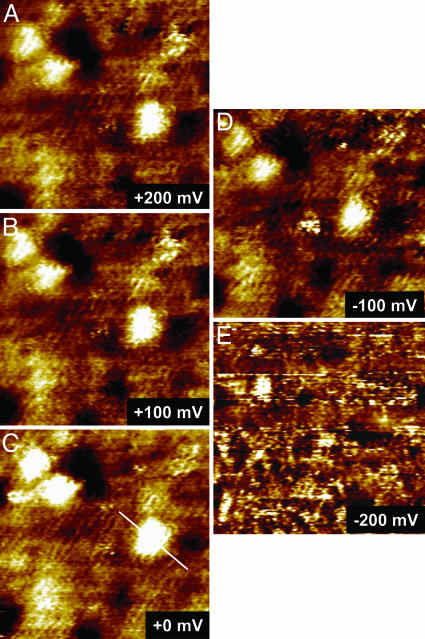
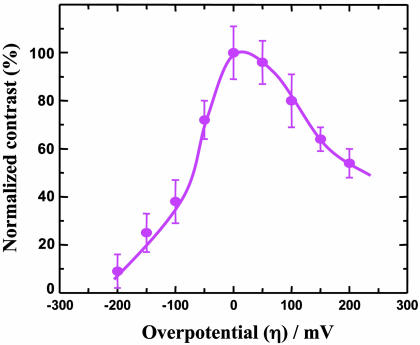
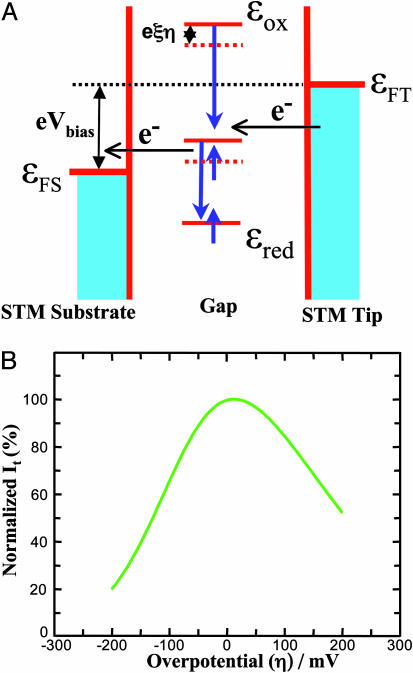
A biomimetic long-range electron transfer (ET) system consisting of the blue copper protein azurin, a tunneling barrier bridge, and a gold single-crystal electrode was designed on the basis of molecular wiring self-assembly principles. This system is sufficiently stable and sensitive in a quasi-biological environment, suitable for detailed observations of long-range protein interfacial ET at the nanoscale and single-molecule levels. Because azurin is located at clearly identifiable fixed sites in well controlled orientation, the ET configuration parallels biological ET. The ET is nonadiabatic, and the rate constants display tunneling features with distance-decay factors of 0.83 and 0.91 A(-1) in H(2)O and D(2)O, respectively. Redox-gated tunneling resonance is observed in situ at the single-molecule level by using electrochemical scanning tunneling microscopy, exhibiting an asymmetric dependence on the redox potential. Maximum resonance appears around the equilibrium redox potential of azurin with an on/off current ratio of approximately 9. Simulation analyses, based on a two-step interfacial ET model for the scanning tunneling microscopy redox process, were performed and provide quantitative information for rational understanding of the ET mechanism.


Figures

Fig. 1.
Fig. 1.
Assembly and characterization of azurin monolayers. (A) Schematic representation of noncovalent interactions between the methyl group of alkanethiol (octanethiol is represented here, and the thiol group is ignored) and the hydrophobic patch of azurin. The hydrophobic patch consisting of specific amino acid residues is extracted from the x-ray crystallographic structure according to ref. . (B) Schematic illustration of azurin molecules wired by the octanethiol monolayer self-assembled on the Au(111) surface, with a molecular orientation of the copper center facing the electrode surface. (C) A STM image of the azurin monolayer with molecular resolution obtained at the azurin/octanethiol/Au(111) system in NH4Ac buffer (pH 4.6). Scan area is 200 × 200 nm, It = 0.1 nA, Vbias =–0.25 V, and substrate potential =+0.2 V vs. SCE. (D) A typical cyclic voltammogram of the azurin/octanethiol/Au(111) system in the same buffer as in STM imaging (C) with a scan rate of 2 V·s–1. The shaded area shows the anodic Faradaic charge.
Fig. 2.
Fig. 2.
Stability evaluation and distant electron transfer. (A) Stability evaluation of the system represented by azurin/octanethiol/Au(111) subjected to successive cyclic voltammetry scans at 5 V·s–1, equivalent to a redox switch frequency of ≈10 Hz. The relative charges were obtained by integrating the redox peaks and normalizing vs. the initial charge. (B) Distance-dependent ET kinetics shown by a plot of the rate constant (in natural logarithm) vs. the distance. The distance was estimated according to refs. and for the alkanethiolate lengths on the gold surface. The decay factors (defined as the rate decay per unit distance), obtained from the slopes (for long-chain alkanethiols, n > 8), were 0.83 and 0.91 Å–1 in H2O and D2O media, respectively.
Fig. 3.
Fig. 3.
A series of STM images showing in situ observations of redox-gated electron-tunneling resonance arising from single azurin molecules. The images were obtained by using the azurin/octanethiol/Au(111) system in NH4Ac buffer (pH 4.6) with a fixed bias voltage (defined as Vbias = ETES) of –0.2 V but variable substrate overpotentials (vs. the redox potential of azurin, +100 mV vs. SCE): +200 (A), +100 (B), 0 (C), –100 (D), and –200 mV (E). Scan area is 35 × 35 nm.
Fig. 4.
Fig. 4.
A correlation between the normalized contrast and the overpotential, showing an asymmetric dependence with a maximum on/off ratio of ≈9.
Fig. 5.
Fig. 5.
Theoretical analysis and computation. (A) Schematic energy diagram of the ECSTM showing the relative energy levels of the substrate, the tip, and the redox molecule. εFS and εFT denote the Fermi levels of the substrate and the tip, respectively; the energy levels of the redox molecule at the oxidized and reduced forms are represented by εox and εred, respectively. (B) Dependence of STM tunneling current on the overpotential calculated by Eqs. 1-3 (see the text) with ρt = 0.42 and ρs = 0.29 number of states·eV–1·atom–1, αt = αs = 0.5, Vbias =–0.2 V, Er = 0.45 eV, κS = 0.1, κt = 0.01, ξ = 0.7, γ = 0.20, θ = 5.6 eV–1, ωeff = 1013, T = 295 K, and other parameters with their normal values. The tunneling current is normalized relative to the maximum value.

References

    1. Marcus, R. & Sutin, A. N. (1985) Biochim. Biophys. Acta 811, 265–322.
    1. Barbara, P. F., Meyer, T. J. & Ratner, M. A. (1996) J. Phys. Chem. 100, 13148–13168.
    1. Jortner, J. & Ratner, M. A., eds. (1997) Molecular Electronics (Blackwell, Oxford).
    1. Jortner, J. & Bixon, M., eds. (1998) Electron Transfer from Isolated Molecules to Biomolecules: Advances in Chemical Physics (Wiley, New York), Vols. 106 and 107.
    1. Kuznetrov, A. M. & Ulstrup, J. (1999) Electron Transfer in Chemistry and Biology: An Introduction to the Theory (Wiley, Chichester, U.K.).

Publication types

LinkOut - more resources