. 2005 Nov;126(5):481-97.
doi: 10.1085/jgp.200509319.

A spatiotemporal white noise analysis of photoreceptor responses to UV and green light in the dragonfly median ocellus

Affiliations

A spatiotemporal white noise analysis of photoreceptor responses to UV and green light in the dragonfly median ocellus

Joshua van Kleef et al. J Gen Physiol. 2005 Nov.

Abstract

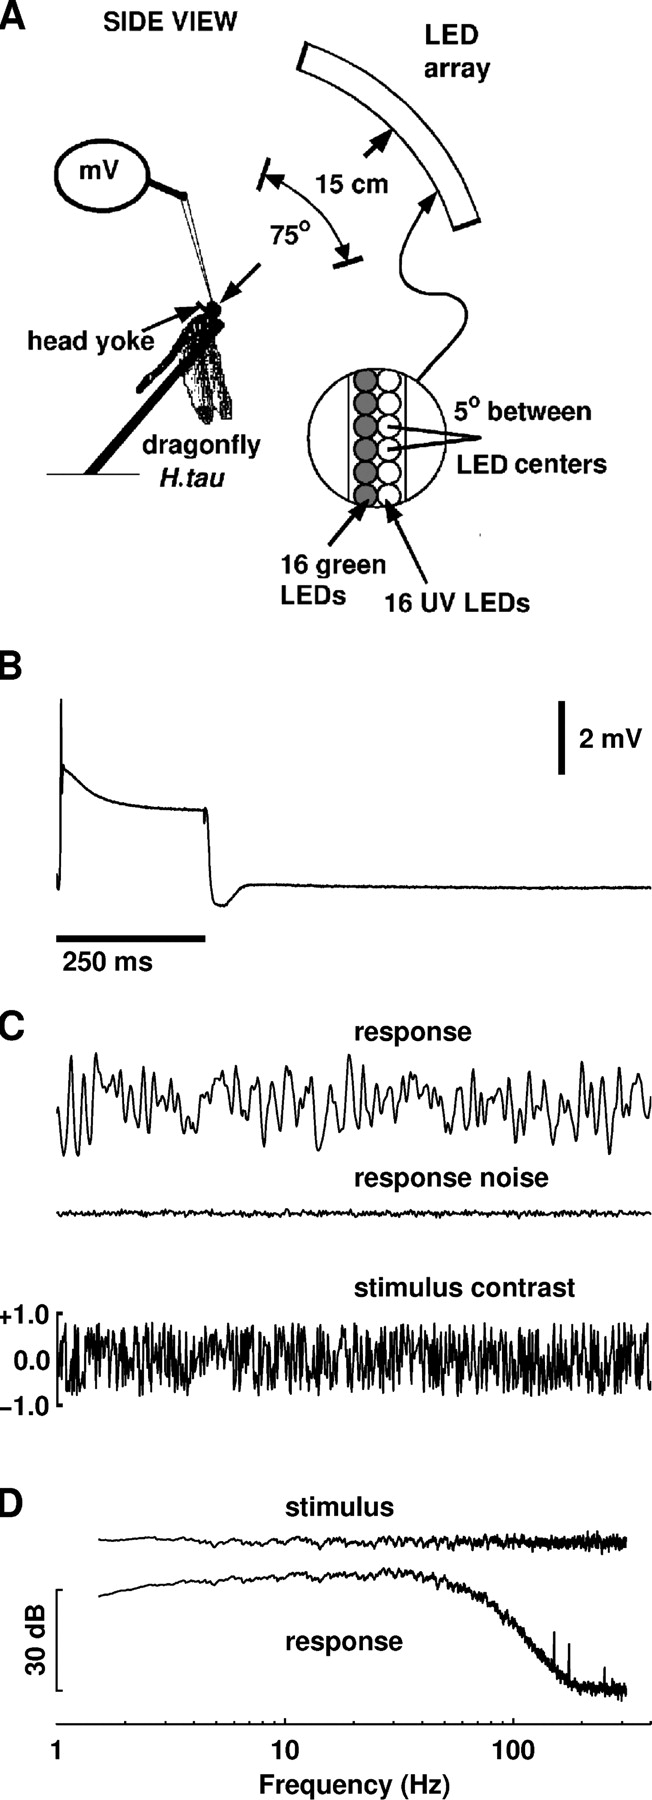
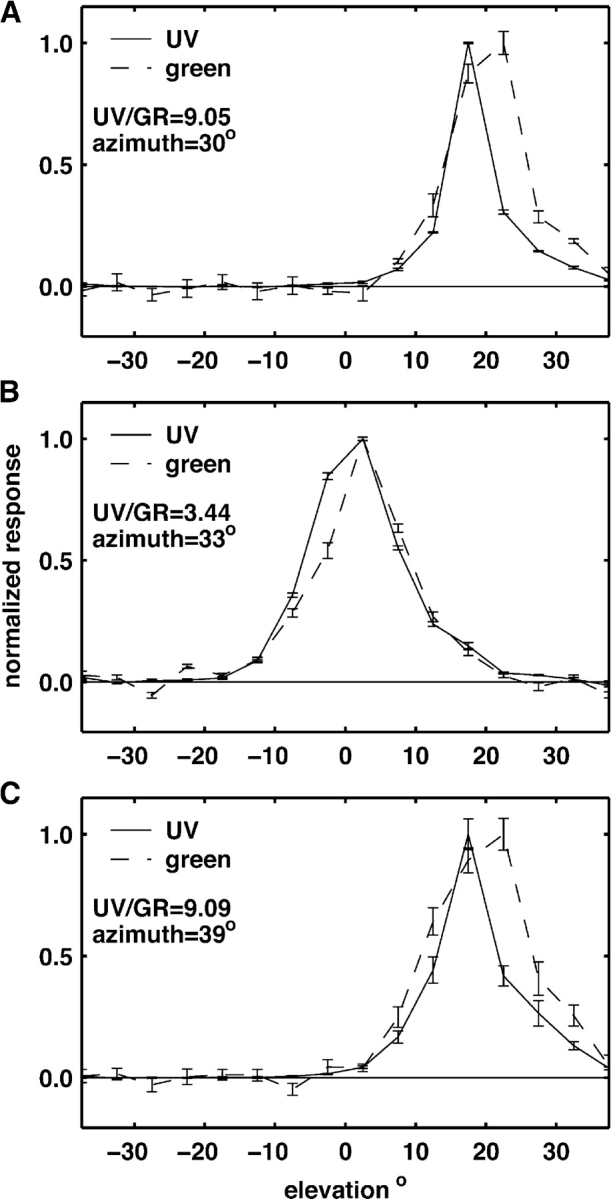
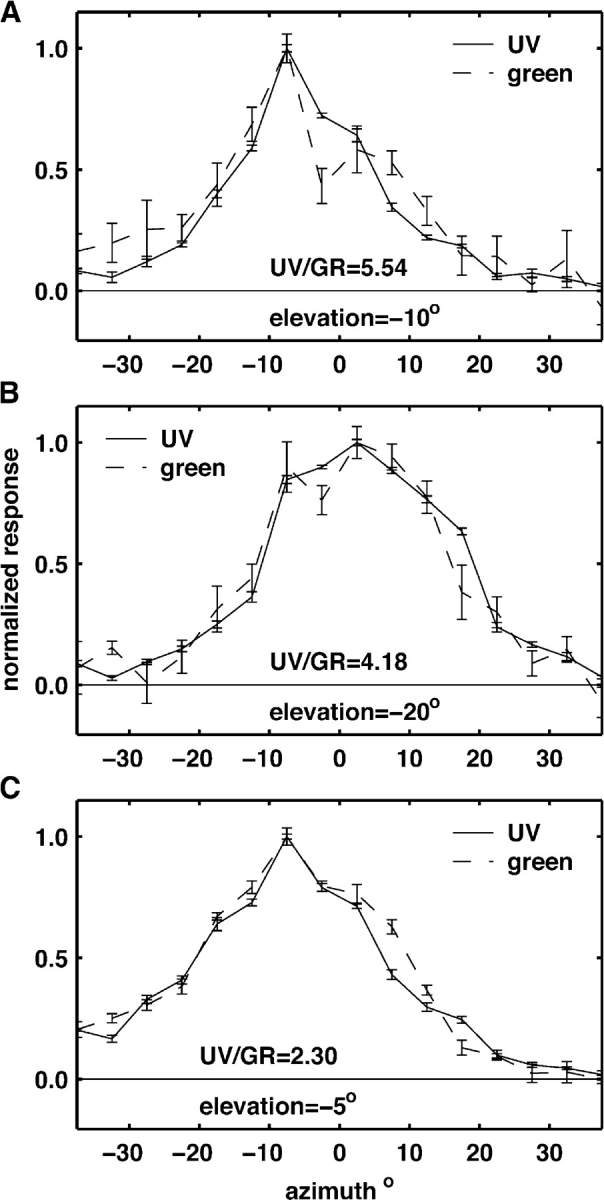
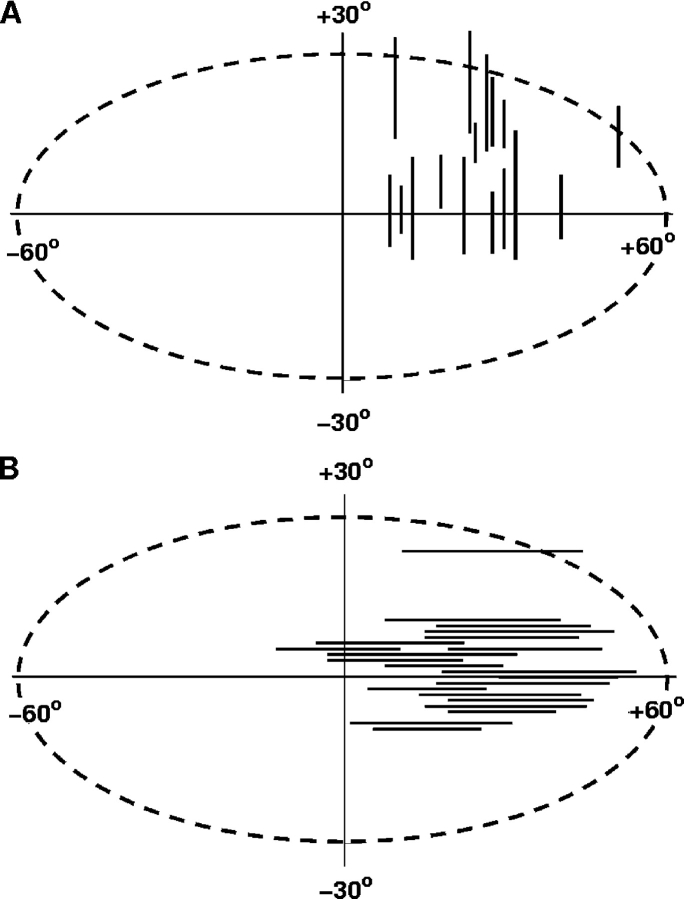
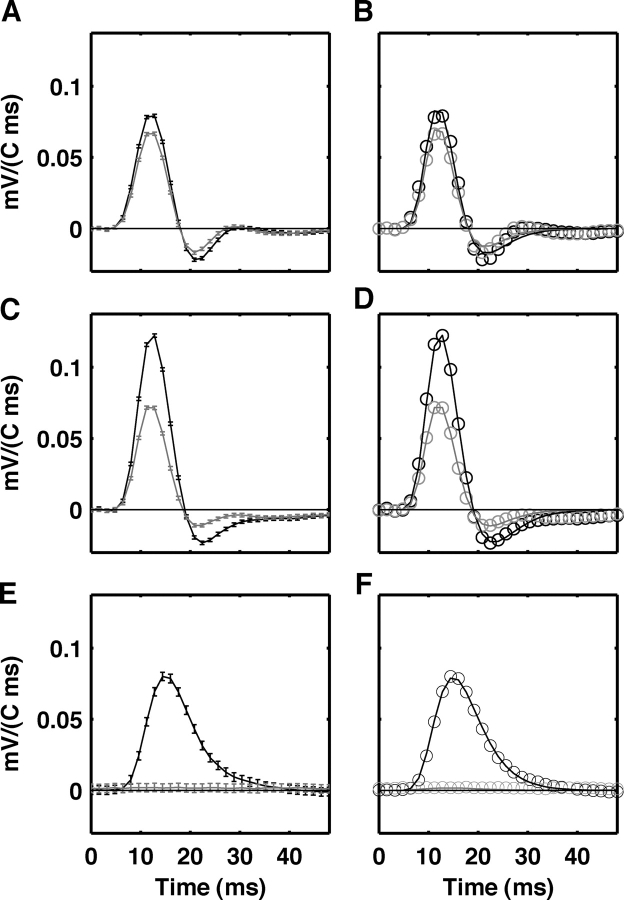
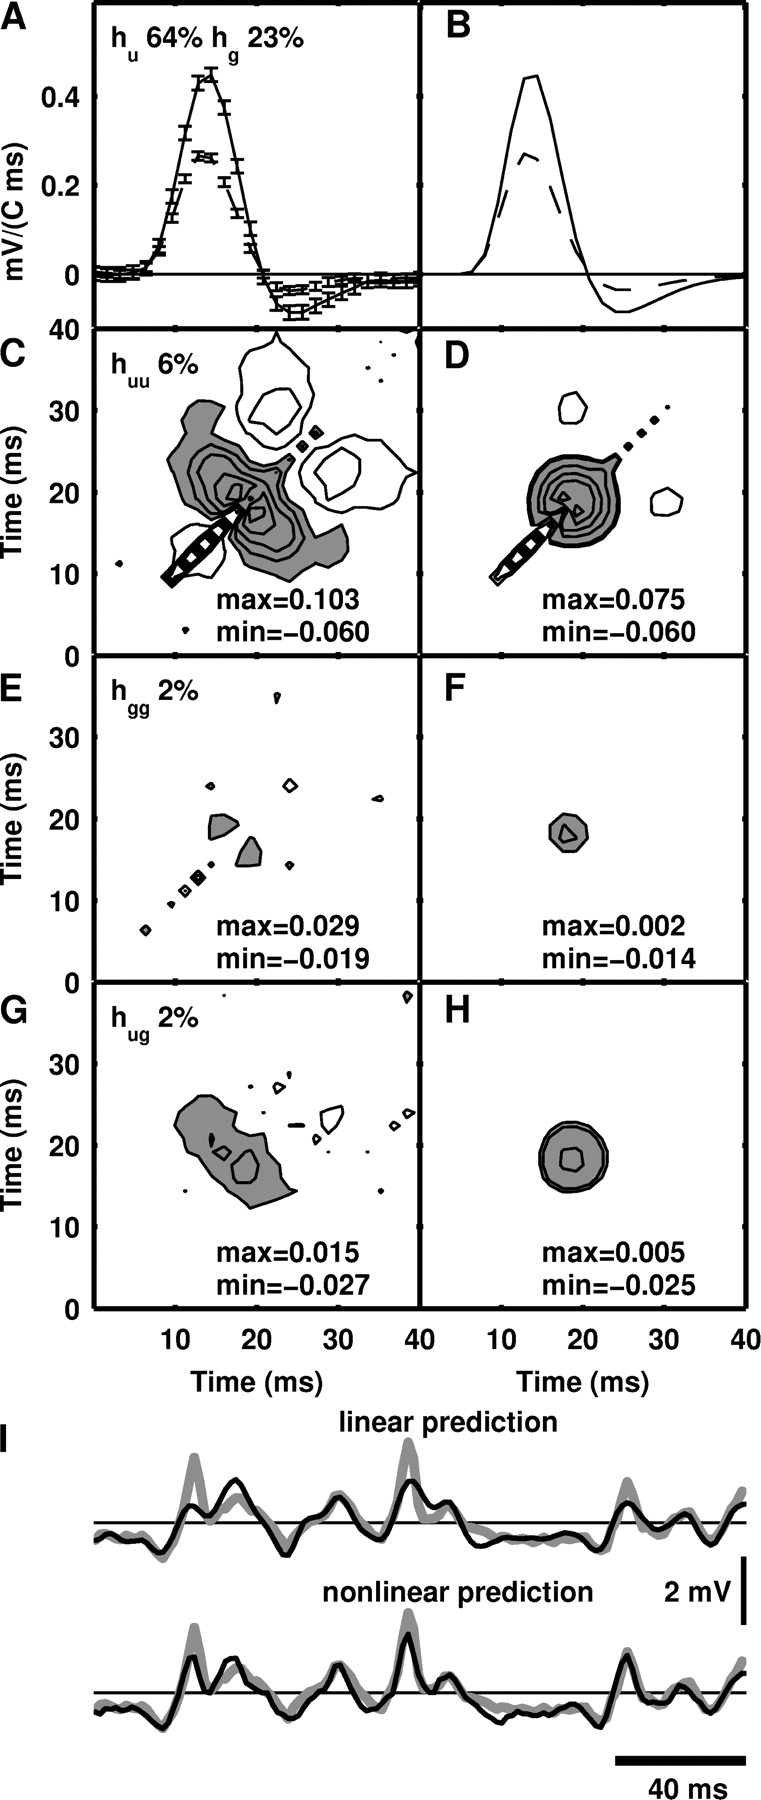
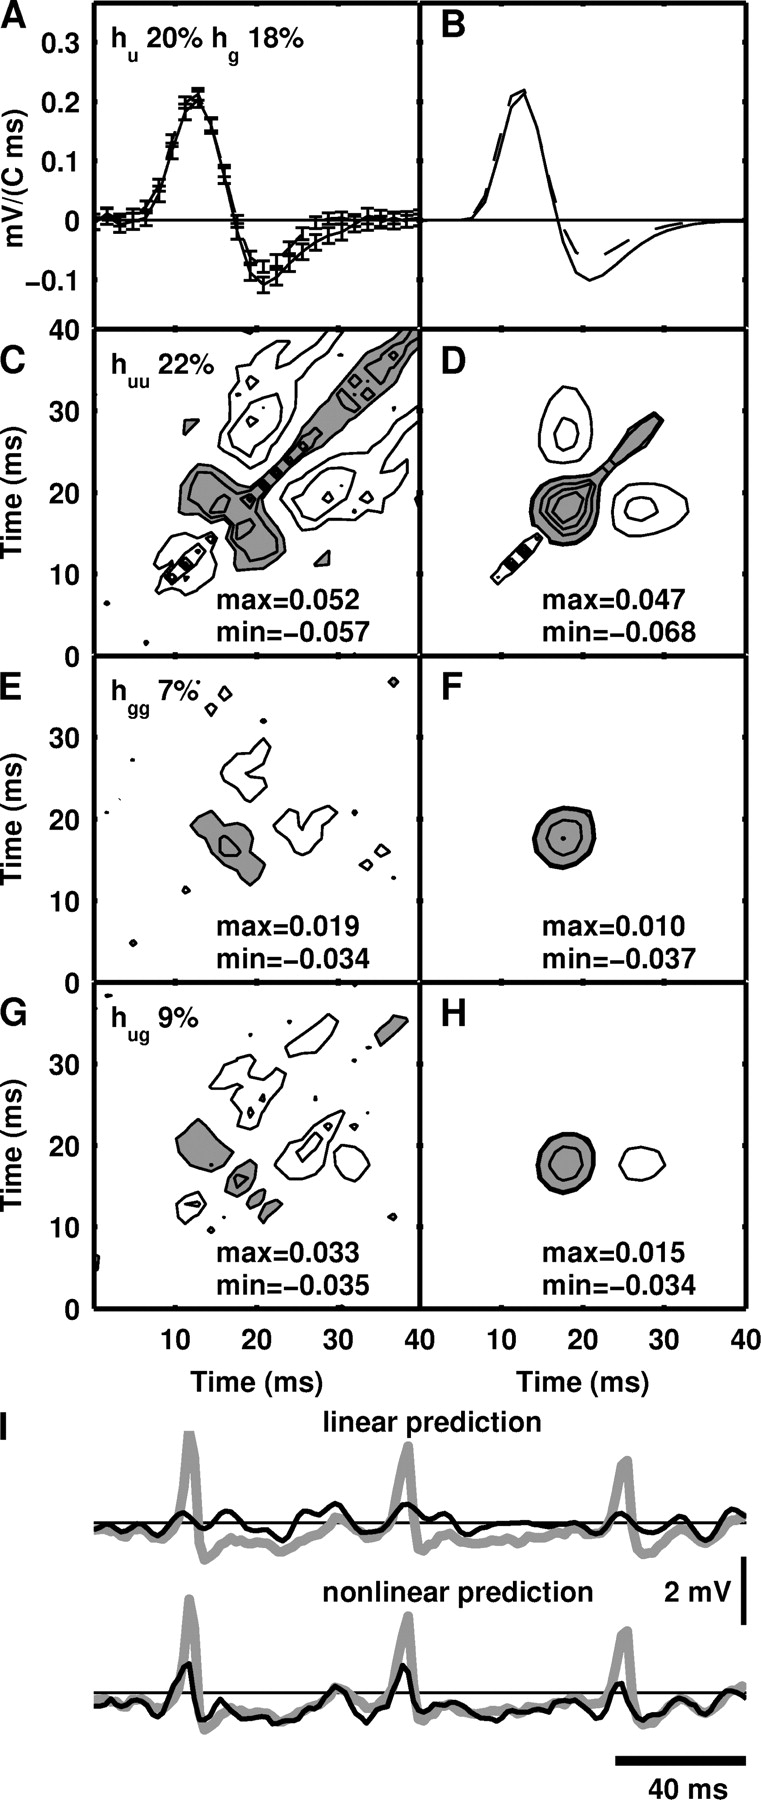
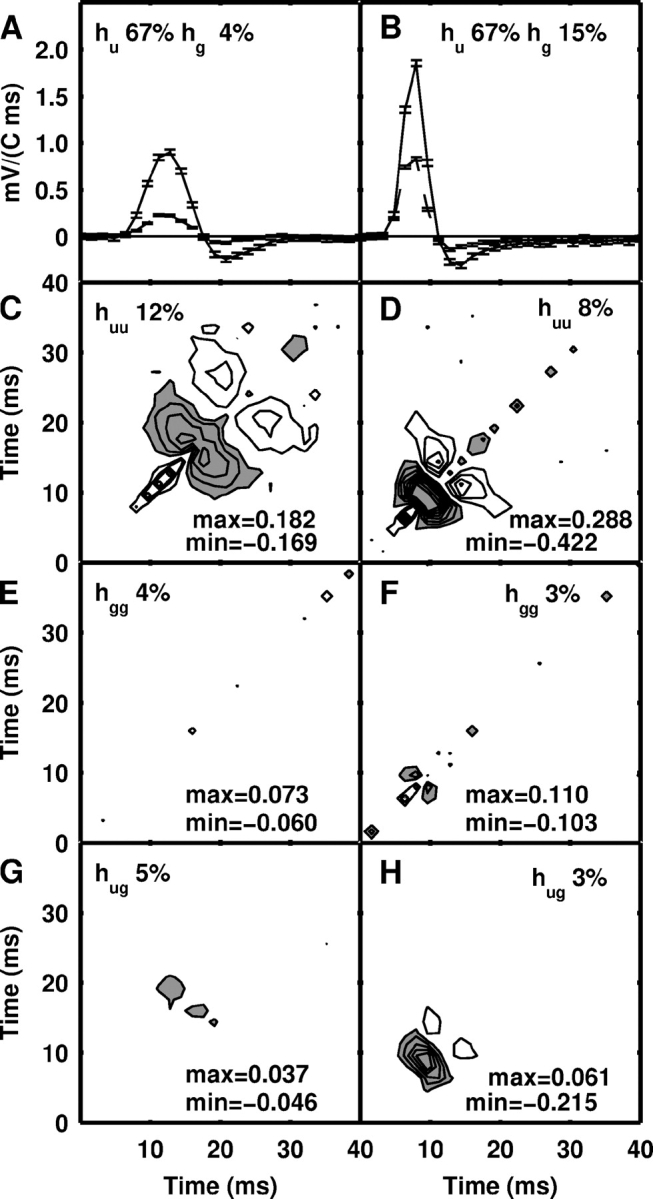
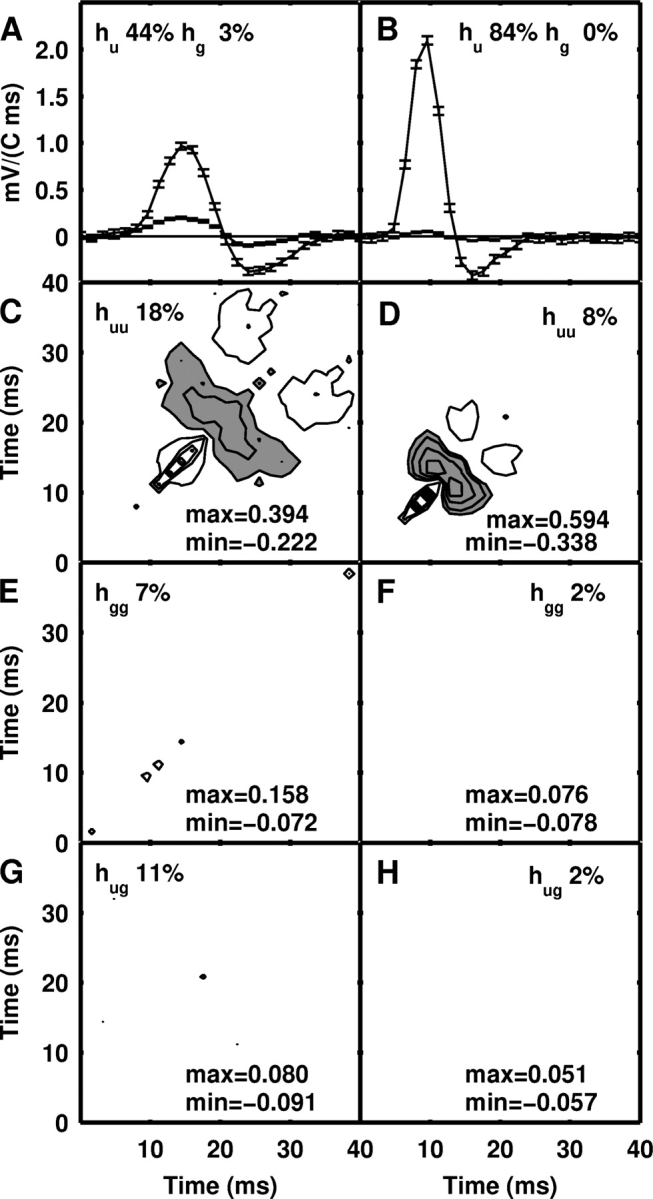
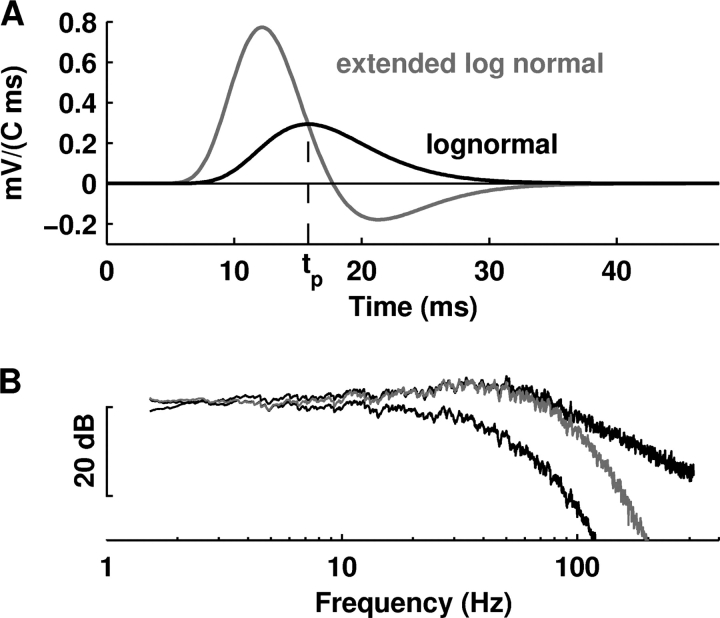
Adult dragonflies augment their compound eyes with three simple eyes known as the dorsal ocelli. While the ocellar system is known to mediate stabilizing head reflexes during flight, the ability of the ocellar retina to dynamically resolve the environment is unknown. For the first time, we directly measured the angular sensitivities of the photoreceptors of the dragonfly median (middle) ocellus. We performed a second-order Wiener Kernel analysis of intracellular recordings of light-adapted photoreceptors. These were stimulated with one-dimensional horizontal or vertical patterns of concurrent UV and green light with different contrast levels and at different ambient temperatures. The photoreceptors were found to have anisotropic receptive fields with vertical and horizontal acceptance angles of 15 degrees and 28 degrees, respectively. The first-order (linear) temporal kernels contained significant undershoots whose amplitudes are invariant under changes in the contrast of the stimulus but significantly reduced at higher temperatures. The second-order kernels showed evidence of two distinct nonlinear components: a fast acting self-facilitation, which is dominant in the UV, followed by delayed self- and cross-inhibition of UV and green light responses. No facilitatory interactions between the UV and green light were found, indicating that facilitation of the green and UV responses occurs in isolated compartments. Inhibition between UV and green stimuli was present, indicating that inhibition occurs at a common point in the UV and green response pathways. We present a nonlinear cascade model (NLN) with initial stages consisting of separate UV and green pathways. Each pathway contains a fast facilitating nonlinearity coupled to a linear response. The linear response is described by an extended log-normal model, accounting for the phasic component. The final nonlinearity is composed of self-inhibition in the UV and green pathways and inhibition between these pathways. The model can largely predict the response of the photoreceptors to UV and green light.


Figures

Figure 1.
Figure 1.
(A) Schematic diagram of the experimental set-up. Dragonflies were exposed to 20 s pseudorandom sequences displayed on 16 UV and 16 green LEDs, refreshed at 625 Hz. The display, shown in the vertical position, was also positioned horizontally. Changes in membrane potential (mV) were recorded intracellularly from an electrode inserted from the ventral surface. (B) Receptor response to the 250-ms test stimulus of UV and green. The response shown is an average of eight repeats. (C) The top signal shows the response of the same receptor cell as in B to the white noise stimulus type II. The noise in this response, calculated as the difference between two experimental repeats is shown below as well as the UV stimulus that produced the response (green not shown). (D) Power spectra of the stimulus and response shown in C plotted on an arbitrary (dB) scale.
Figure 2.
Figure 2.
Normalized angular sensitivities in elevation to UV (ρu) and green (ρg) light are shown for three cells A, B, and C. These were obtained by performing a singular value decomposition of the first-order spatiotemporal kernels estimated for these cells. The UV to green ratio, at peak response, is given for each cell (UV/GR), as well as the azimuthal position of the vertically mounted display. Error bars indicate SEM.
Figure 3.
Figure 3.
Angular sensitivities in azimuth to UV (ρu) and green (ρg) light are shown for three cells (A, B, and C). Details are the same as in Fig. 2 but with the elevation of the horizontally mounted display given for each cell.
Figure 4.
Figure 4.
(A) Elevation angular sensitivities of 16 receptor neurons and (B) azimuthal angular sensitivities of 25 receptor neurons. Lines represent the spans for which responses were >50%. The dashed ellipses (width 120°, height 60°) represent the total field of view of the ocellus, as determined by optical measurements.
Figure 5.
Figure 5.
Time components of UV (ψu) and green (ψg) first-order kernels (A, C, and E) and modified log-normal fits to these functions for the same three cells (B, D, and F). The black and gray lines indicate UV and green response, respectively. Error bars indicating the SEM in the time component of the first-order kernels are shown in (A, C, and E). The circles in B, D, and F represent the kernel values fitted. Parameter values obtained from fits to Eq. 6 are: B(a) UV vu = 0.034 mV(C·ms)−1, tu p = 15.7 ms, σu = 0.281, τu d = 10.5 ms, and green vg = 0.032 mV(C·ms)−1, tg p = 15.4 ms, σg = 0.272, τg d = 8.8 ms; B(b) UV vu = 0.051 mV(C·ms)−1, tu p= 16.4 ms, σu = 0.291, τu d = 10.9 ms, and green vg = 0.034 mV(C·ms)−1, tg p = 15.7 ms, σg = 0.283, τg d = 8.8 ms; B(c) UV vu = 0.068 mV(C·ms)−1, tu p = 17.7 ms, σu= 0.300, τu d = 2.9 ms, and green vg = 0.002 mV(C·ms)−1, tg p = 14.7 ms, σg = 0.396, τg d = 1.1 ms.
Figure 6.
Figure 6.
First-order (A and B) and second-order (C–H) temporal kernels together with the reconstructed signals of a receptor with a small nonlinear component. Kernels were estimated using multiple linear regression on the detrended data yd (A, C, E, and G) or produced from directly fitting the NLN sandwich model described by Eqs. 6 and 7 (B, D, F, and H). Percentages show the power of the reconstructed signal of the kernels as a percentage of detrended signal power. Maximum and minimum values are given at the bottom of each figure and the negative regions of these kernels, indicating inhibition, are shaded. Contours are at 10% levels of the maximum value of the kernel in each case. (A and B) First-order kernels hu (solid line) and hg (dashed line) that describe the linear response of a receptor to UV and green contrasts, respectively. Error bars in A indicate the SEM. (C and D) The second-order kernels huu that account for UV light potentiating the response of the cell to UV light. (E and F) The second-order kernels hgg that account for green potentiation of the green response. (G and H) The cross-kernels hug that account for the interactions between UV and green response. The equivalent kernels for A, C, E, and G were produced with linear UV parameters: vu = 0.193 mV(C·ms)−1, tu p = 18.0 ms, σu = 0.281, τu d = 11.2 ms, and linear green parameters: vg = 0.133 mV(C·ms)−1, tg p = 17.5 ms, σg= 0.290, and τg d = 9.2 ms. The nonlinear model parameters for this model are: a1 = 0.171 C−1, a2 = 0.0 C−1, b1 = 0.008 mV−1, b2 = 0.010 mV−1, b3 = 0.005 mV−1, τi = 4.9 ms. I. The measured response of a receptor cell (thick gray line) is shown for an interval of 200 ms together the predicted signals (dark lines) from linear kernel alone (linear prediction) and combined linear and nonlinear kernels (nonlinear prediction).
Figure 7.
Figure 7.
First-order (A and B) and second-order (C–H) temporal kernels estimated directly from the data (A, C, E, and G) or from the NLN model (B, D, F, and H) are shown for a receptor with a larger nonlinear component of response. The full and linear kernel predictions of the response are shown separately in I. Details are the same as Fig. 6, however contours are at 20% levels. The linear UV parameters used are: vu = 0.030 mV(C·ms)−1, tu p = 16.4 ms, σu = 0.259, τu d = 41.5 ms, and linear green parameters are: vg = 0.076 mV(C·ms)−1, tg p = 15.8 ms, σg = 0.259, and τg d = 13.1 ms. The nonlinear model parameters obtained from fit are: a1 = 0.226 C−1, a2 = 0.042 C−1, b1 = 0.037 mV−1, b2 = 0.039 mV−1, b3 = 0.019 mV−1, τi = 5.5 ms.
Figure 8.
Figure 8.
First-order kernels for UV (hu), green (hg) (A and B), together with their second-order kernels huu (C and D), hgg (E and F), and hug (G and H) for a cell at 22°C (A, C, E, and G) and 33°C (B, D, F, and H). Details for both columns are the same as the left hand side of Fig. 6 (A, C, E, and G). In this cell, the relative UV to green ratio of the cell is reduced at the elevated temperature.
Figure 9.
Figure 9.
First-order kernels for UV (hu), green (hg) (A and B), together with their second-order kernels huu (C and D), hgg (E and F), and hug (G and H) for a cell at 22°C (A, C, E, and G) and 32°C (B, D, F, and H). Details are the same as for Fig. 8. In this case the relative UV to green ratio of the maximal cell response is increased at the elevated temperature and the power in the nonlinear kernels is reduced.
Figure 10.
Figure 10.
(A) A comparison of the log-normal and modified log-normal models with the same parameters values for (vu, tu p, σu). The parameters were obtained by fitting the extended log-normal model (Eq. 6) to the first-order kernel of a receptor neuron. The peak response is larger and the time at which peak response actually occurs is earlier for the extended log-normal function. (B) Comparison of the response power spectra for the linear models seen in A: the extended log-normal model (middle line) and log-normal model with equivalent parameters (bottom line). The top line indicates the power spectrum of the recorded signal.

References

    1. Adolph, A.R. 1973. Thermal sensitivity of lateral inhibition in Limulus eye. J. Gen. Physiol. 62:392–406. - PMC - PubMed
    1. Anderson, J.C., and S.B. Laughlin. 2000. Photoreceptor performance and the coordination of achromatic and chromatic inputs in the fly visual system. Vision Res. 40:13–31. - PubMed
    1. Chappell, R.L., and R.D. DeVoe. 1975. Action spectra and chromatic mechanisms of cells in the median ocelli of dragonflies. J. Gen. Physiol. 65:399–419. - PMC - PubMed
    1. Chappell, R.L., and J.E. Dowling. 1972. Neural organization of the median ocellus of the dragonfly. I. Intracellular electrical activity. J. Gen. Physiol. 60:121–147. - PMC - PubMed
    1. Corbet, P.S. 1999. Dragonflies: behaviour and ecology of Odonata. Harley Books, Martins, Essex, UK. 829 pp.

Publication types