. 2005 Nov;126(5):529-38.
doi: 10.1085/jgp.200509377.

Coupled K+-water flux through the HERG potassium channel measured by an osmotic pulse method

Affiliations

Coupled K+-water flux through the HERG potassium channel measured by an osmotic pulse method

Hiroyuki Ando et al. J Gen Physiol. 2005 Nov.

Abstract

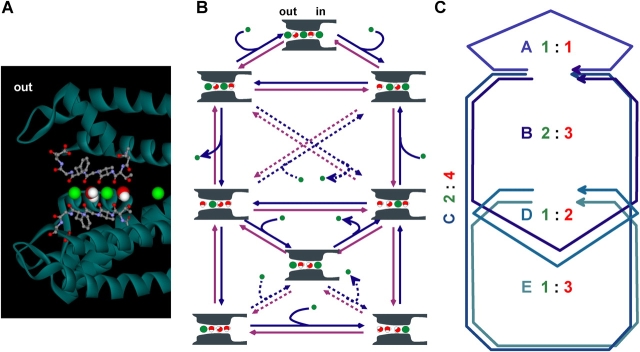
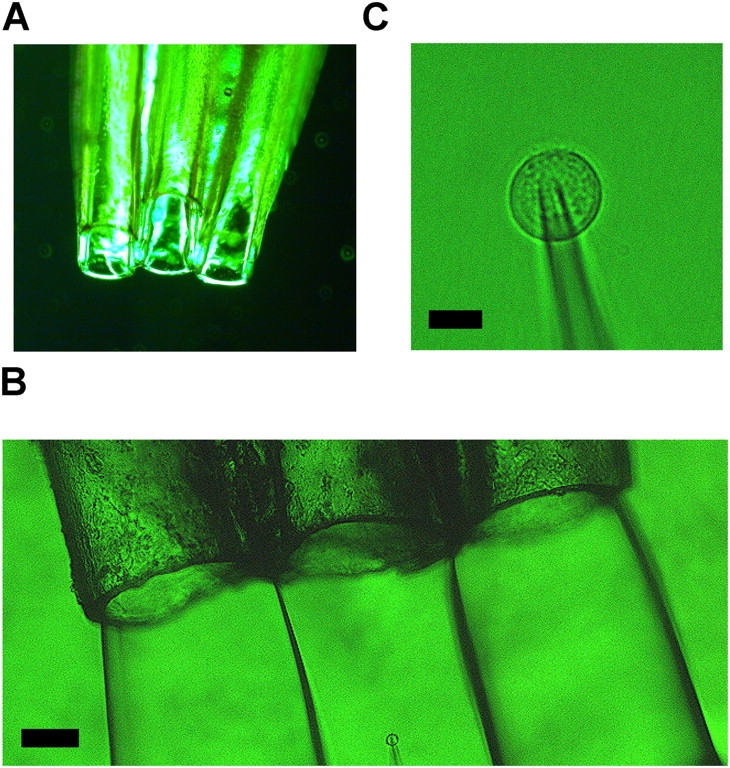
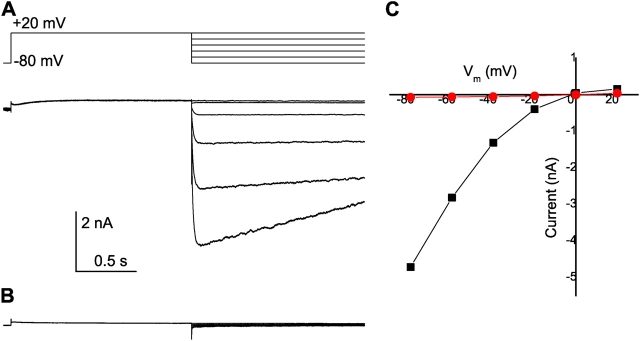
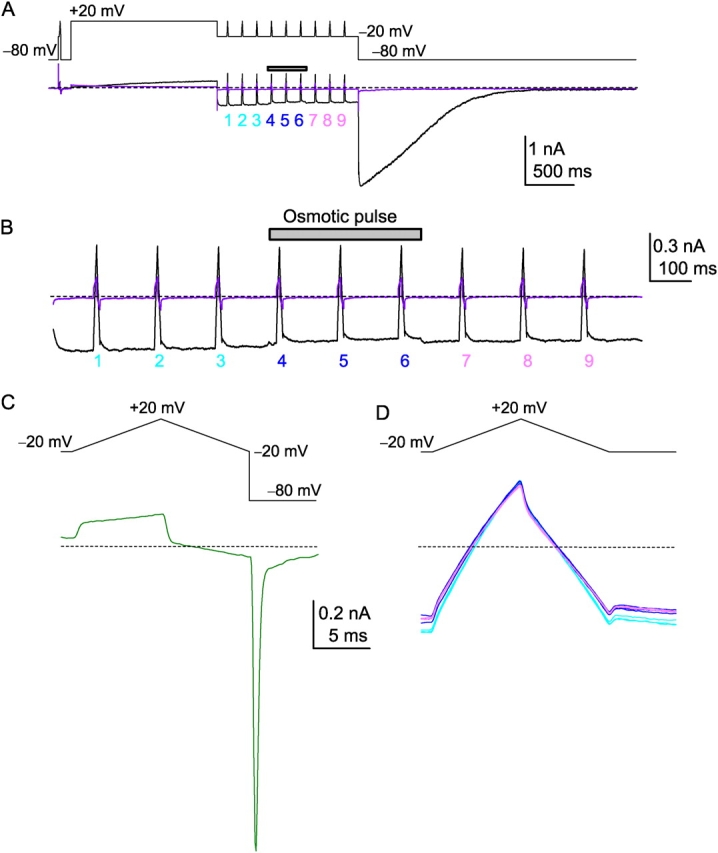
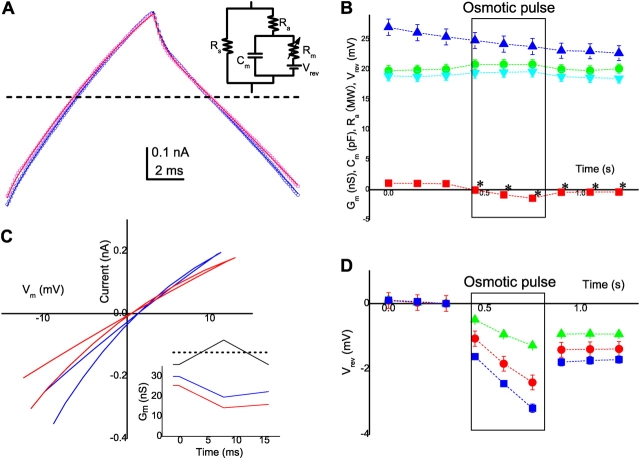
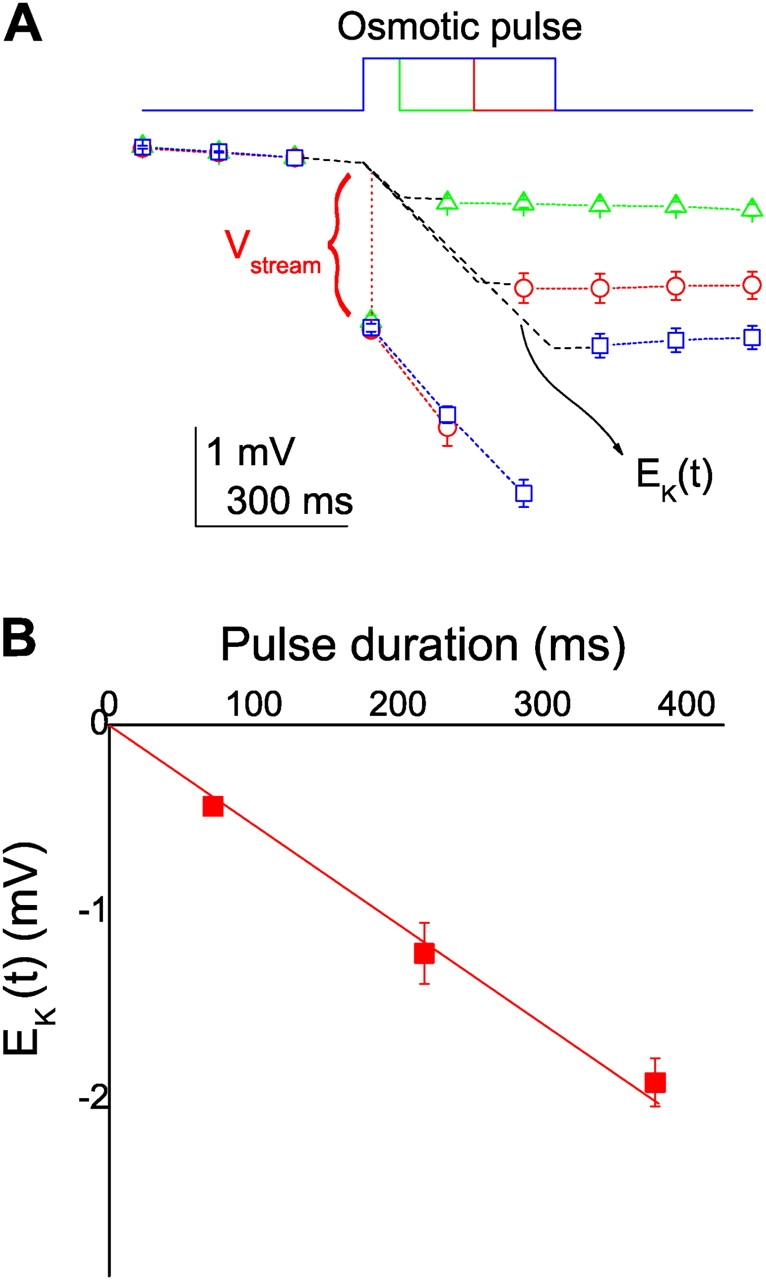
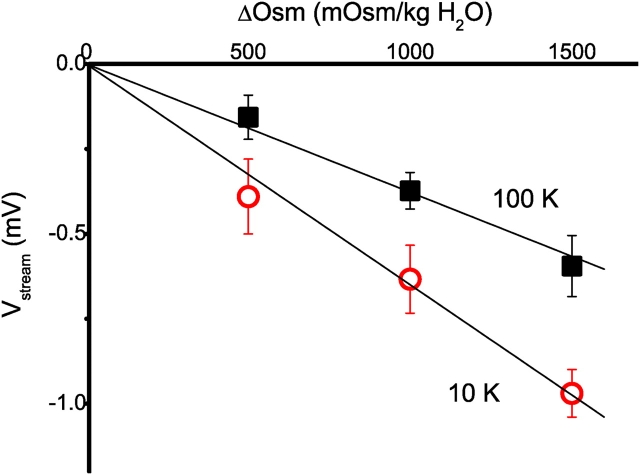
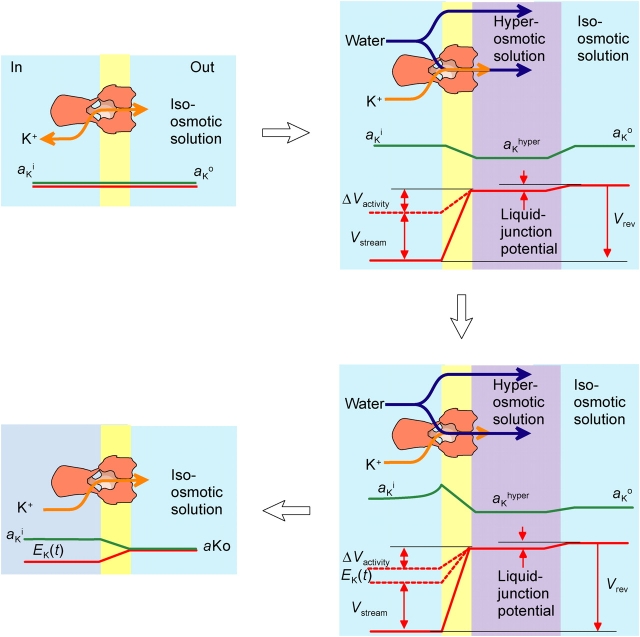
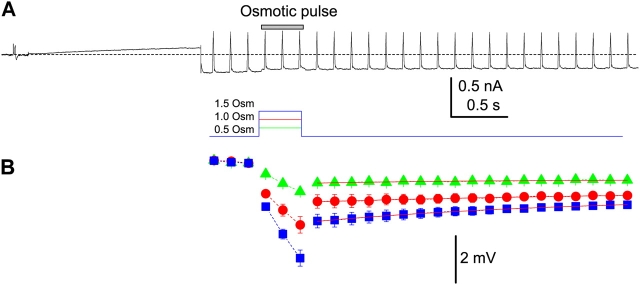
The streaming potential (V(stream)) is a signature feature of ion channels in which permeating ions and water molecules move in a single file. V(stream) provides a quantitative measure of the ion and water flux (the water-ion coupling ratio), the knowledge of which is a prerequisite for elucidating the mechanisms of ion permeation. We have developed a method to measure V(stream) with the whole-cell patch-clamp configuration. A HEK293 cell stably expressing the HERG potassium channel was voltage clamped and exposed to hyperosmotic solutions for short periods of time (<1 s) by an ultrafast solution switching system (the osmotic pulse [quick jump-and-away] method). The reversal potentials were monitored by a series of voltage ramps before, during, and after the osmotic pulse. The shifts of the reversal potentials immediately after the osmotic jump gave V(stream). In symmetrical K+ solutions (10 mM), the V(stream)s measured at different osmolalities showed a linear relationship with a slope of -0.7 mV/DeltaOsm, from which the water-ion coupling ratio (n, the ratio of the flux of water to the flux of cations; Levitt, D.G., S.R. Elias, and J.M. Hautman. 1978. Biochim. Biophys. Acta. 512:436-451) was calculated to be 1.4. In symmetrical 100 mM K+ solutions, the coupling ratio was decreased significantly (n = 0.9), indicating that the permeation process through states with increased ion occupancy became significant. We presented a diagrammatic representation linking the water-ion coupling ratio to the mode of ion permeation and suggested that the coupling ratio of one may represent the least hydrated ion flux in the single-file pore.


Figures

Figure 1.
Figure 1.
Permeation of K+ and water molecules through potassium channels. Green, potassium ion; red, water molecule. (A) A distribution of K+ and water molecules in the pore of the KcsA channel. The single-file nature of K+ and water molecules is seen in the selectivity filter. The selectivity filter is shown by the ball-and-stick model. (B) The simplified shift-permeation model for K+ and water permeation through a K+-selective pore (left side, extracellular). Each cartoon represents a K+–water-occupied state in the selectivity filter. Arrows indicate transitions between states, which accompany shift movements of ion–water columns. Blue arrows indicate transitions for efflux; purple arrows for influx. Curved arrows indicate K+ entering or exiting from the selectivity filter. Arrows representing the exchange transitions, in which K+ and a water molecule exchange at either end of the filter and no shift movements accompany, are shown by broken lines. (C) A cycle flux diagram. Each cycle was drawn by connecting states, by completing a cycle, net movements of ion and water were performed. For each cycle, the ratio of coupled transport of K+ and water molecules (K+ [green number]: water molecules [red number]) is indicated (the coupling ratio = water/K+). For example, the cycle A exhibits the coupling ratio of one; the cycle C and D show the coupling ratio of two. At low K+ concentrations, the probability being in cycles at lower positions, such as in cycle D and E, is high. As K+ concentration increases, cycle fluxes at upper positions become predominant. Cycle fluxes with exchange transitions are not shown.
Figure 2.
Figure 2.
The jump-and-away system. (A) A triple-barrel tube. Only a part of the tip is shown. (B) A triple-barrel tube (top) and a patch-clamped cell (bottom). The inner diameter of the tube is 250 μm. Center outflow, the iso-osmotic solution. The patch-clamped cell was placed in the midst of the flow of the iso-osmotic solution (the flow rate was 0.07–0.08 ml/min). Left and right outflows, the hyperosmotic solutions (1,000 and 1,500 mOsm). (C) A patch-clamped HEK293 cell under flow. The scale bars are 100 μm and 10 μm for B and C, respectively.
Figure 3.
Figure 3.
HERG current expressed in HEK293 cells. (A) Tail current recordings at different potentials. Currents were elicited by depolarizing pulses at +20 mV followed by hyperpolarizing pulses (from 0 to −80 mV). (B) Currents remaining after treatment with 10 μM E-4031. (C) Current–voltage curves of tail currents before (black symbols) and after (red symbols) the treatment of E-4031 measured at 50 ms after the steps to repolarizing potentials.
Figure 4.
Figure 4.
HERG current recordings and the osmotic pulse. (A) The time course of the current recording in symmetrical 100 mM K+ solution. Top, voltage protocol; Bottom, current traces. Preactivation ramp command: prior to the long depolarization pulse, a brief prepulse to −20 mV followed by a depolarization–repolarization ramp was applied. Activation ramp command: nine ramp commands were delivered at −20 mV (numbering 1 to 9). The osmotic pulse (380 ms, 1000 mOsm) was applied from just before the 4 ramp to just after the 6 ramp. Current trace in violet color indicates recordings after the treatment of E-4031. (B) A train of the ramp currents with an expanded time scale. An osmotic pulse induced a slight depression of the inward current. (C) A current trace (bottom) for the preactivation ramp command (top). (D) Current traces (bottom) for the activation ramp command (top) before (light blue), during (dark blue), and after (light purple) the osmotic pulse. Broken lines indicate the zero current level.
Figure 5.
Figure 5.
The evaluation of V rev. (A) Recorded ramp currents (open symbols) just before an osmotic pulse (3; blue) and the first one during the osmotic pulse (4; red; 1,000 mOsm). The current through the equivalent membrane circuit (inset, the variable membrane resistance [R m], the membrane capacitance [C m], the series resistance [R a], and the seal resistance [R s]) for the ramp command was simulated. The free parameters (V rev, G m [= 1/R m], R a, and C m) were optimized and the fitted curves were superimposed on the recorded currents. (B) The time course of changes in the fitted parameters during a train. ▴, G m (nS); •, R a (MΩ); ▾, C m (pF); ▪, V rev (mV). The starting time for the first ramp (1) was set to zero. The pulse duration was boxed, starting from 440 ms and ending at 820 ms. The first ramp during the pulse (4) was applied immediately (<10 ms) after the jump. For V rev, error bars were within the sizes of the symbols and the asterisks indicate statistical significance (P < 0.05). (C) I-V curves reconstructed from the fitted parameters for the current traces in A. Current amplitudes were calculated as (V memb[t] − V rev[t]) × G m (t) and plotted as a function of V memb[t]. All the values are time-based variables and a parametric plot was performed. Inset, the ramp command and the time course of the membrane conductance. The conductance changes were correlated to the time course of the ramp command. The slopes of the conductance changes were optimized. (D) The time courses of V rev changes for different osmolalities. ▴, 500 mOsm; •, 1000 mOsm; and ▪, 1500 mOsm. The V rev values were normalized by the values for ramp 3.
Figure 6.
Figure 6.
(A) Time courses of V rev for osmotic pulses with different durations. V rev values for each train were normalized by the value of prepulse (3). Osmotic pulses of 1,500 mOsm were applied for 75, 230, or 380 ms, during which one, two, or three ramps were delivered. The time courses of E K(t) during a pulse was drawn as a broken line through interpolation from the start of the osmotic pulse to the end of the pulse. (B) The V rev value on return to the iso-osmotic solution (E K) as a function of the pulse duration.
Figure 7.
Figure 7.
V stream and its osmolality dependency. V stream as a function of the osmolality. Linear fits with slopes of −0.4 mV/ΔOsm and −0.7 mV/ΔOsm were obtained for 100 mM and 10 mM K+.
Figure 8.
Figure 8.
A scheme for potential profile around the channel. Lines indicate the concentration profile (green) and potential profile (red).
Figure A1.
Figure A1.
Time courses of the V rev changes. (A) A current trace for a long train of ramps. A total of 25 ramps were applied at −20 mV. The osmotic pulse was applied from 4 to 6. (B) Time courses of V rev for different osmotic pulses. V rev values for each train were normalized by the value of prepulse (3). Time courses of recovery from the pulse (from 7 to 25) were fitted by a single-exponential function (red lines). The time constants were 1.5 s, 3.5 s, and 2.3 s for 500 mOsm, 1000 mOsm, and 1500 mOsm, respectively.

References

    1. Alcayaga, C., X. Cecchi, O. Alvarez, and R. Latorre. 1989. Streaming potential measurements in Ca2+-activated K+ channels from skeletal and smooth muscle. Coupling of ion and water fluxes. Biophys. J. 55:367–371. - PMC - PubMed
    1. Berneche, S., and B. Roux. 2001. Energetics of ion conduction through the K+ channel. Nature. 414:73–77. - PubMed
    1. Chung, S.H., T.W. Allen, M. Hoyles, and S. Kuyucak. 1999. Permeation of ions across the potassium channel: Brownian dynamics studies. Biophys. J. 77:2517–2533. - PMC - PubMed
    1. Dani, J.A. 1989. Open channel structure and ion binding sites of the nicotinic acetylcholine receptor channel. J. Neurosci. 9:884–892. - PMC - PubMed
    1. Finkelstein, A., and O.S. Andersen. 1981. The gramicidin A channel: a review of its permeability characteristics with special reference to the single-file aspect of transport. J. Membr. Biol. 59:155–171. - PubMed

Publication types

MeSH terms