. 2005 Nov;62(22):2669-78.
doi: 10.1007/s00018-005-5318-6.

Rescue of heterochromatin organization in Hutchinson-Gilford progeria by drug treatment

Affiliations

Rescue of heterochromatin organization in Hutchinson-Gilford progeria by drug treatment

M Columbaro et al. Cell Mol Life Sci. 2005 Nov.

Abstract

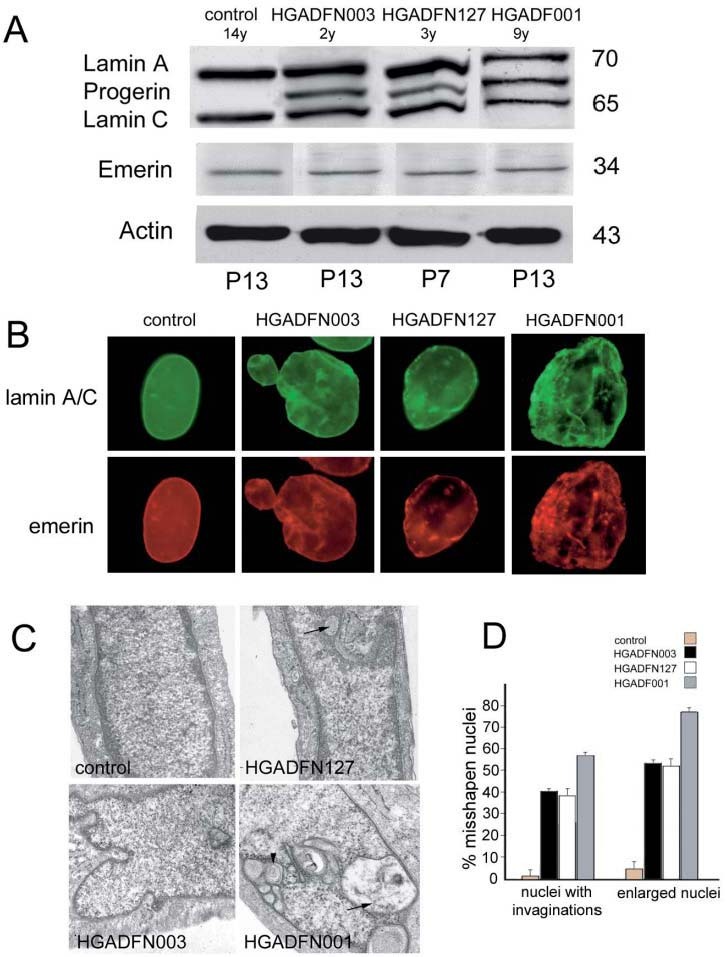
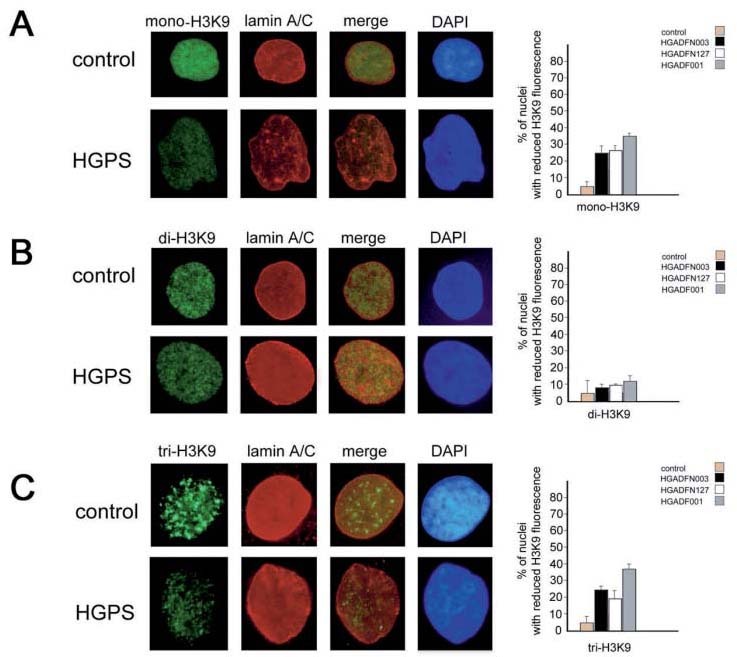
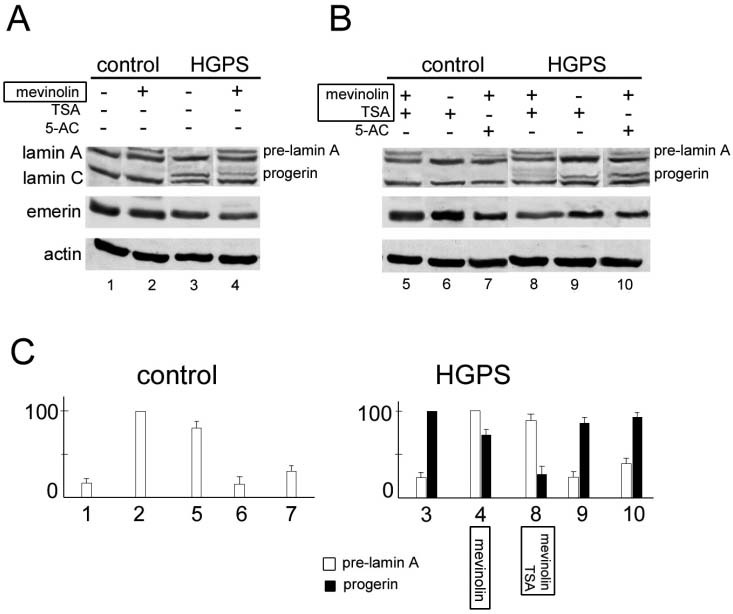
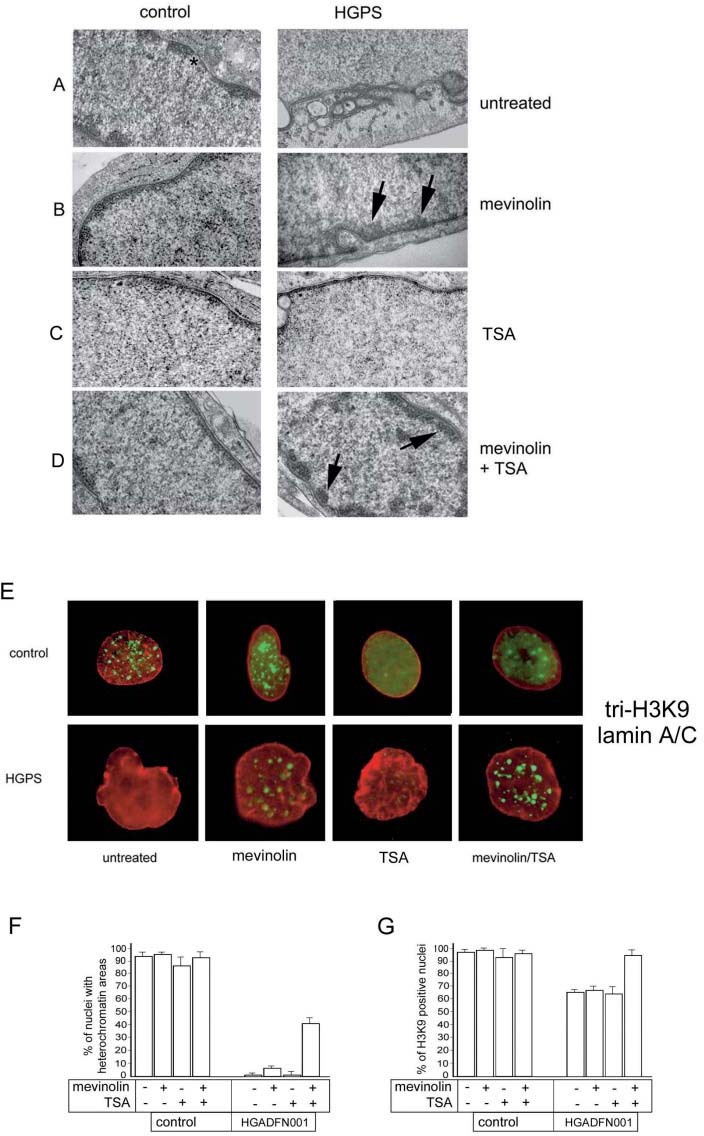
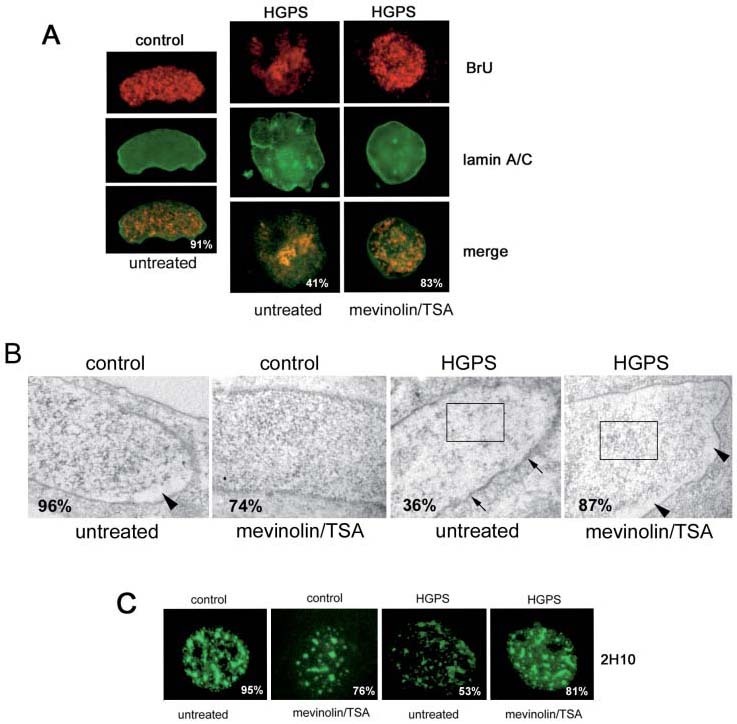
Hutchinson-Gilford progeria (HGPS) is a premature aging syndrome associated with LMNA mutations. Progeria cells bearing the G608G LMNA mutation are characterized by accumulation of a mutated lamin A precursor (progerin), nuclear dysmorphism and chromatin disorganization. In cultured HGPS fibroblasts, we found worsening of the cellular phenotype with patient age, mainly consisting of increased nuclear-shape abnormalities, progerin accumulation and heterochromatin loss. Moreover, transcript distribution was altered in HGPS nuclei, as determined by different techniques. In the attempt to improve the cellular phenotype, we applied treatment with drugs either affecting protein farnesylation or chromatin arrangement. Our results show that the combined treatment with mevinolin and the histone deacetylase inhibitor trichostatin A dramatically lowers progerin levels, leading to rescue of heterochromatin organization and reorganization of transcripts in HGPS fibroblasts. These results suggest that morpho-functional defects of HGPS nuclei are directly related to progerin accumulation and can be rectified by drug treatment.


Figures

Figure 1
Figure 1
Nuclear defects in HGPS fibroblasts. (A) Western blot analysis of lamins in HGPS fibroblasts. Lamin A and C were expressed at normal levels in the cell lines HGADFN003 (passage 13) and HGADFN127 (passage 7), while both lamin A and C levels were decreased in the cell line HGADFN001 (passage 13). Progerin (67 kDa) was detected in all examined cellular lysates, with an increased proportion relative to mature lamin A in the older patient cell line HGADFN001. The emerin level was not altered in HGPS cells. Molecular-weight markers are reported in kDa. The age of each patient is indicated (y, years), the number of cell passages is indicated in the lower row (p, passages). (B) One control cell line and three HGPS cell lines (HGADFN003, HGADFN127 and HGADFN001; see Materials and methods for details) were examined by IF analysis using anti-lamin A/C (green) and anti-emerin antibodies (red). The nuclear shape was altered in HGPS fibroblasts and the nuclear envelope invaginations are evident. Emerin mostly colocalized with lamin A/C. Nuclear shape abnormalities increased in the older cell line. (C) Ultrastructural analysis of control and HGPS nuclei (HGADFN003, HGADFN127 and HGADFN001; see Materials and methods for details). Nuclear invaginations are evident in 50% of examined nuclei from HGADFN127 cells and their frequency increased in HGADFN003 and HGADADFN001 cells. Heterochromatin loss was observed in all HGPS cell lines and heterochromatin areas were completely absent from HGADFN0001 nuclei. Nuclear invaginations including the outer nuclear membrane (arrowheads) or selectively involving the inner nuclear membrane and the lamina (including the perinuclear cisterna, arrows) are shown. (D) Quantitation of misshapen nuclei shown in B. Nuclei showing at least five invaginations were considered nuclei with invaginations (left columns). Nuclei showing an increase in the major diameter of at least 20% of control nuclei were considered enlarged nuclei (right columns). One thousand nuclei were scored per cell line (see legend for details). Triplicate staining experiments (lamin A/C-emerin staining) were examined. Mean values including standard errors of the mean were calculated and reported as percentage of counted nuclei.
Figure 2
Figure 2
Immunofluorescence labeling of methylated H3 histone species in control and HGPS fibroblasts. H3K9 labeling was performed by specific antibodies and revealed by FITC-conjugated secondary antibody (green); lamin A/C was labeled by polyclonal antibody and revealed by Cy-3-conjugated secondary antibody (red); DNA was counterstained with DAPI; mono- H3K9 labeling (A); di- H3K9 labeling (B); tri-H3K9 labeling (C). A representative experiment performed in HGADFN127 fibroblasts is shown in this picture. Quantitation of H3K9 staining shown in each panel is reported on the right. Bars show the mean percentage of nuclei with reduced fluorescence intensity. Nuclei with reduced fluorescence intensity were considered the nuclei with less than 50% of the mean fluorescence intensity measured in control nuclei (Lucia Image Version 4.61 software was used to measure fluorescence intensity per area). Mean values of triplicate counting performed in each patient cell line (see legend for details) including standard errors of the mean were calculated.
Figure 3
Figure 3
WB analysis of lamins in drug-treated HGPS fibroblasts. Control and HGPS fibroblasts were subjected to drug treatment, lysed and protein separation was obtained by SDS-PAGE. An immunoblot was performed using anti-lamin A/C or anti-emerin antibodies. (A) Untreated control fibroblasts show an almost undetectable amount of pre-lamin A (lane 1). Untreated HGPS fibroblasts show a low amount of wild-type pre-lamin A and a high amount of progerin (lane 3). Increased pre-lamin A levels were observed after mevinolin addition in all examined cell lines (lanes 2 and 4). The amount of progerin was reduced in mevinolintreated HGPS cells (lane 4). (B) Further treatment with TSA led to a slight reduction in wild-type pre-lamin A levels (lanes 5, 8), while the progerin level was strikingly lowered (lane 8). TSA treatment (in the absence of mevinolin) slightly increased the lamin A/C level both in control (lane 6) and HGPS cells (lane 9), but minimally affected the progerin level (lane 9). The Wild-type prelamin A was reduced by addition of 5-azadeoxycytidine (5-AC) to mevinolin-treated control (lane 7) and HGPS cells (lane 10). The amount of progerin was not affected by 5-AC (lane 10). The lamin A/C level was minimally affected by 5-AC (lane 7 and 10). Emerin was not altered by drug treatments in control or HGPS cell lines. Actin bands are labeled as a loading control. A representative experiment is shown of three different experiments performed in each control and HGPS cell line. (C) Densitometric analysis of pre-lamin A and progerin immunoblotted bands shown in A and B. Pre-lamin A values are reported as the percentage of pre-lamin A amount detected in mevinolin-treated cells; progerin values are reported as the percentage of progerin amount detected in untreated HGPS cells. Values are the mean ± standard error of the mean of three independent experiments performed in HGADFN001 cells.
Figure 4
Figure 4
Heterochromatin organization in mevinolin/TSA-treated HGPS fibroblasts. (A–D) Experiments are representative of three independent analyses performed in each cell line, and the pictures were obtained by transmission electron microscopy. (A) Heterochromatin areas are evident at the nuclear periphery of untreated control nuclei, except at the nuclear pores (*). In untreated HGADFN001 nuclei, peripheral heterochromatin is absent. (B) Mevinolin treatment elicited formation of heterochromatin areas both in control and HGPS cells. The percentage of nuclei showing heterochromatin areas was increased by 5% in HGADFN001 nuclei. (C) TSA treatment did not significantly change the number of nuclei with heterochromatin areas either in control or in HGPS cells. (D) Mevinolin plus TSA treatment slightly affected heterochromatin organization in control fibroblasts, while it raised to 40% the percentage of HGADFN001 nuclei showing heterochromatin areas. (E) Double-IF staining of tri-H3K9 and lamin A/C in HGADFN001 fibroblast nuclei. Anti-tri-H3K9 antibody was revealed by FITC-conjugated secondary antibody (green); anti-lamin A/C antibody was revealed by Cy3-conjugated secondary antibody (red). Tri-H3K9 labeled discrete foci in control nuclei (control), while labeling was lost in 36% of HGPS nuclei (HGPS). Mevinolin treatment (mevinolin) did not affect the number of tri-H3K9-positive control cells, while slightly increasing the number of tri-H3K9-positive HGPS cells. TSA treatment (TSA) affected the distribution of tri-H3K9 foci in control cells, while it was not effective in HGPS cells. In HGPS nuclei, complete recovery of tri-H3K9 labeling was obtained after mevinolin + TSA treatment (mevinolin/TSA). (F) Quantitation of the electron microscopy analysis shown in panels A-D. The percentage of nuclei showing at least four heterochromatin areas was reported for control and HGADFN001 fibroblasts. (G) Quantitation of tri-H3K9 positive nuclei in HGADFN001 fibroblasts before and after each drug treatment (shown in E). Mean values of triplicate experiments including standard errors of the mean were calculated. One thousand nuclei per sample were counted.
Figure 5
Figure 5
Transcript distribution was altered in HGPS nuclei. (A) In situ transcription assay showing uniform BrU staining in control nuclei (91% out of 200 counted nuclei) and reduced transcriptional activity and nonuniform BrU distribution in enlarged HGADF001 nuclei (41% out of 200 counted nuclei). Uniform BrU staining was observed in HGPS nuclei after mevinolin/TSA treatment (83% out of 200 counted nuclei) (right column). RNA transcripts incorporating BrU were labeled by anti-BrU antibody and revealed by Cy-3-conjugated secondary antibody (red). The nuclear lamina was labeled by anti-lamin A/C antibody and revealed by FITC-conjugated secondary antibody (green). The merged images (merge) underscore the different BrU distribution in control and HGPS nuclei. Images were obtained by fluorescence microscopy. (B) EDTA-reverse staining of a control and an HGADFN001 nucleus. In the control nucleus, clusters of electron-dense ribonucleoproteins were observed at the nuclear interior, while peripheral bleached heterochromatin was detected as unstained areas (arrowhead) (96% out of 200 observed nuclei); EDTA staining was observed throughout the nucleus in mevinolin/TSA-treated controls (74% out of 200 observed nuclei). In untreated HGPS nuclei, a diffuse gray staining was observed and electron-dense ribonucleoproteins were reduced (36% out of 200 observed nuclei) (the irregular thickness of the nuclear lamina was indicated by arrows); in mevinolin/TSA-treated HGPS nuclei ribonucleoprotein staining was restored and bleached heterochromatin areas were detected at the nuclear periphery (arrowheads) (87% out of 200 observed nuclei). Different patterns of ribonucleoprotein staining were seen within the rectangle areas; images were taken by transmission electron microscopy. (C) The labeling pattern of intranuclear lamin A labeled by the 2H10 antibody corresponded to a speckled distribution (control) (95% out of 200 observed nuclei); mevinolin/TSA treatment did not affect 2H10 labeling in the majority of control nuclei (76% out of 200 observed nuclei); lamin A 2H10 stained in irregularly distributed foci at the nuclear interior of HGADFN001 cells (HGPS, untreated) (53% out of 200 observed nuclei); a staining pattern comparable to control nuclei was obtained by treating HGPS cells with mevinolin/TSA (HGPS, mevinolin/TSA) (81% out of 200 observed nuclei). A representative experiment was shown of triplicate experiments performed for each HGPS cell line.

References

    1. De Sandre-Giovannoli A., Bernard R., Cau P., Navarro C., Amiel J., Boccaccio I., et al. Lamin A truncation in Hutchinson-Gilford progeria. Science. 2003;300:2055. doi: 10.1126/science.1084125. - DOI - PubMed
    1. Eriksson M., Brown W.T., Gordon L.B., Glynn M.W., Singer J., Scott L., et al. Recurrent de novo point mutations in lamin A cause Hutchinson-Gilford progeria syndrome. Nature. 2003;423:293–298. doi: 10.1038/nature01629. - DOI - PMC - PubMed
    1. Cao H., Hegele R.A. LMNA is mutated in Hutchinson-Gilford progeria (MIM 176670) but not in Wiedemann-Rautenstrauch progeroid syndrome (MIM 264090) J. Hum. Genet. 2003;48:271–274. doi: 10.1007/s10038-003-0025-3. - DOI - PubMed
    1. D'Apice M.R., Tenconi R., Mammi I., van den Ende J., Novelli G. Paternal origin of LMNA mutations in Hutchinson-Gilford progeria. Clin. Genet. 2004;65:52–54. doi: 10.1111/j..2004.00181.x. - DOI - PubMed
    1. Csoka A.B., Cao H., Sammak P.J., Constantinescu D., Schatten G., Hegele R. A. Novel lamin A/C gene (LMNA) mutations in atypical progeroid syndromes. J. Med. Genet. 2004;41:304–308. doi: 10.1136/jmg.2003.015651. - DOI - PMC - PubMed

Publication types

MeSH terms