

Gene-expression patterns predict phenotypes of immune-mediated thrombosis
- PMID: 16263789
- PMCID: PMC1895419
- DOI: 10.1182/blood-2005-07-2669
Gene-expression patterns predict phenotypes of immune-mediated thrombosis
Retraction in
-
Retraction. Potti A, Bild A, Dressman HK, Lewis DA, Nevins JR, Ortel TL. Gene-expression patterns predict phenotypes of immune-mediated thrombosis. Blood. 2006;107(4):1391-1396.Blood. 2011 Oct 20;118(16):4497. doi: 10.1182/blood-2011-08-375030. Epub 2011 Aug 19. Blood. 2011. PMID: 21856862 Free PMC article. No abstract available.
Abstract
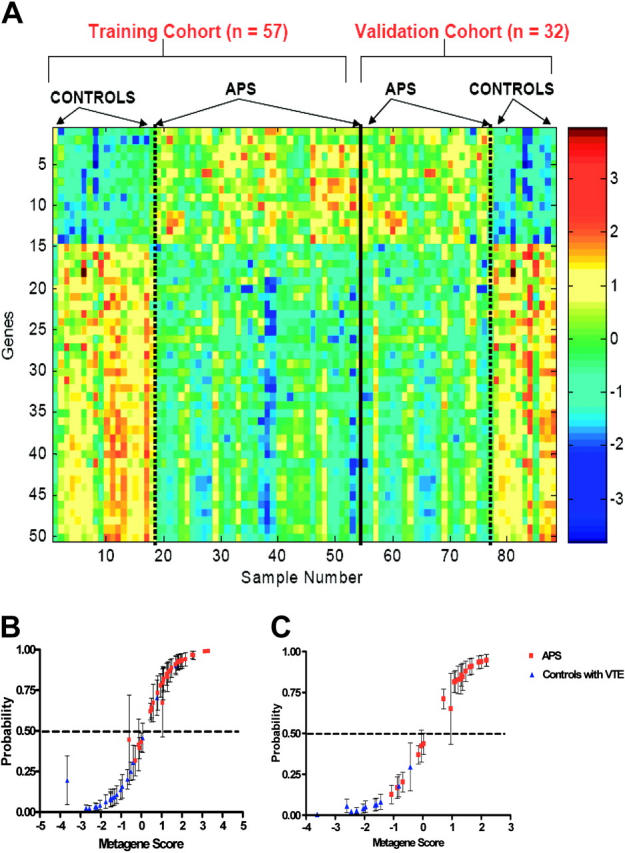
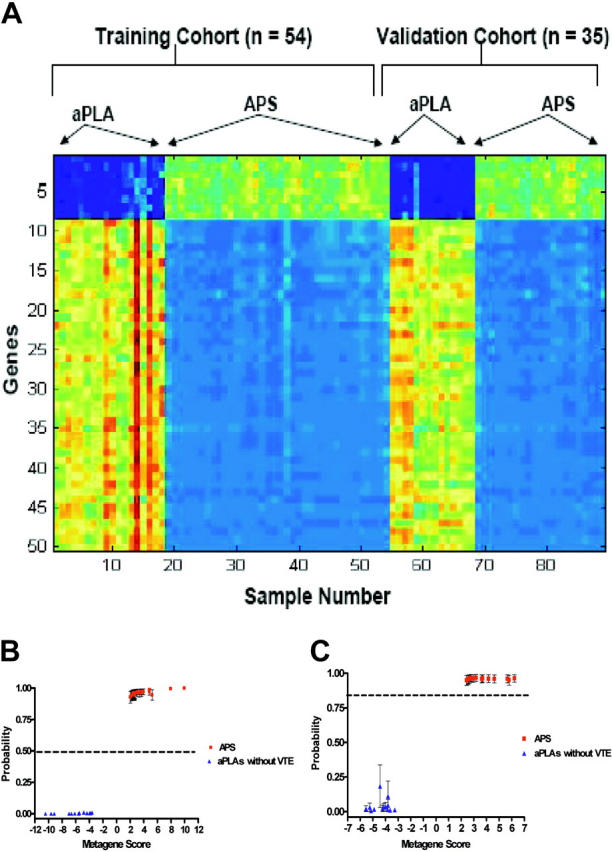
Antiphospholipid antibody syndrome (APS) is a complex autoimmune thrombotic disorder with defined clinical phenotypes. Although not all patients with elevated antiphospholipid antibody (aPLA) levels develop complications, the severity of these potential events mandates aggressive and extended lifelong anti-thrombotic therapy. One hundred twenty-nine patients (57 patients with APS and venous thromboembolism [VTE], 32 patients with VTE without aPLA, 32 patients with aPLA only, and 8 healthy patients) were enrolled. RNA from peripheral-blood collection was used for DNA microarray analysis. Patterns of gene expression that characterize APS as well as thrombosis in the presence of aPLA were identified by hierarchical clustering and binary regression methods. Gene-expression profiles identify and predict individuals with APS from patients with VTE without aPLA. Importantly, similar methods identified expression profiles that accurately predicted those patients with aPLA at high risk for thrombotic events. All profiles were validated in independent cohorts of patients. The ability to predict APS, but more importantly, those patients at risk for venous thrombosis, represents a paradigm for a genomic approach that can be applied to other populations of patients with venous thrombosis, providing for more effective clinical management of disease, while also reflecting the possible underlying biologic processes.
Figures

Comment in
-
Findings of research misconduct.NIH Guide Grants Contracts (Bethesda). 2015 Nov 20:NOT-OD-16-021. NIH Guide Grants Contracts (Bethesda). 2015. PMID: 26601329 Free PMC article. No abstract available.
-
Findings of Research Misconduct.Fed Regist. 2015 Nov 9;80(216):69230-69231. Fed Regist. 2015. PMID: 27737266 Free PMC article. No abstract available.
References
-
- Heit JA, Silverstein MD, Mohr DN, et al. The epidemiology of venous thromboembolism in the community. Thromb Haemost. 2001;86: 452-463. - PubMed
-
- White RH, Zhou H, Romano PS. Incidence of deep venous thrombosis and secondary thromboembolism among ethnic groups in California. Ann Intern Med. 1998;128: 737-740. - PubMed
-
- Perry SL, Ortel TL. Clinical and laboratory evaluation of thrombophilia. In: Tapson VF, ed. Clinics in chest medicine: venous thromboembolism. Philadelphia, PA: WB Saunders Co; 2003: 153-170. - PubMed
-
- Wilson WA, Gharavi AE, Koike T, et al. International consensus statement on preliminary classification criteria for definite antiphospholipid syndrome: report of an international workshop. Arthritis Rheum. 1999;42: 1309-1311. - PubMed
-
- Lockshin MD, Sammaritano LR, Schwartzman S. Validation of the Sapporo criteria for antiphospholipid syndrome. Arthritis Rheum. 2000;43: 440-443. - PubMed
Publication types
MeSH terms
Substances
Grants and funding
LinkOut - more resources
Full Text Sources
Miscellaneous
