. 2005 Nov 15;102(46):16807-12.
doi: 10.1073/pnas.0508282102. Epub 2005 Nov 1.

Chemical imaging of tissue in vivo with video-rate coherent anti-Stokes Raman scattering microscopy

Affiliations

Chemical imaging of tissue in vivo with video-rate coherent anti-Stokes Raman scattering microscopy

Conor L Evans et al. Proc Natl Acad Sci U S A. .

Abstract

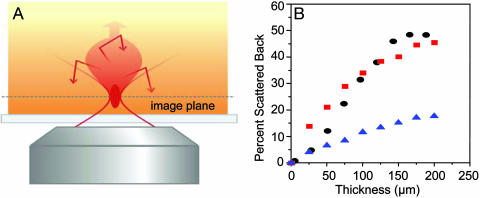
Imaging living organisms with molecular selectivity typically requires the introduction of specific labels. Many applications in biology and medicine, however, would significantly benefit from a noninvasive imaging technique that circumvents such exogenous probes. In vivo microscopy based on vibrational spectroscopic contrast offers a unique approach for visualizing tissue architecture with molecular specificity. We have developed a sensitive technique for vibrational imaging of tissues by combining coherent anti-Stokes Raman scattering (CARS) with video-rate microscopy. Backscattering of the intense forward-propagating CARS radiation in tissue gives rise to a strong epi-CARS signal that makes in vivo imaging possible. This substantially large signal allows for real-time monitoring of dynamic processes, such as the diffusion of chemical compounds, in tissues. By tuning into the CH(2) stretching vibrational band, we demonstrate CARS imaging and spectroscopy of lipid-rich tissue structures in the skin of a live mouse, including sebaceous glands, corneocytes, and adipocytes, with unprecedented contrast at subcellular resolution.


Figures

Fig. 1.
Fig. 1.
Schematic of the real-time CARS imaging microscope, based on a mode-locked Nd:vanadate picosecond laser and a tunable synchronously pumped optical parametric oscillator (OPO). Temporal overlap of the pump and Stokes pulse trains is controlled with an optical delay stage. A fast rotating polygon mirror provides rapid beam scanning in the x-direction, while a synchronized galvanometric mirror scans the beam along the y axis. A 1.2 numerical aperture water immersion lens is used for focusing the beams. Maximum power at the sample is 50 mW for each beam. Signals detected with a red-sensitive photomultiplier tube are processed by a computer and displayed at video rate on a monitor for real-time inspection of the tissue. (Inset) The CARS energy diagram with pump (ωp) and Stokes (ωs) excitation frequencies, the blue-shifted anti-Stokes (ωas) signal frequency, and the vibrational frequency (ωvib) is shown.
Fig. 2.
Fig. 2.
Epi-CARS signal contrast arises from the backscattering of forward propagating photons generated in focus. (A) Schematic of the scattering mechanism responsible for the contrast in epi-CARS from thick tissues. Part of the forward propagating signal is backscattered. (B) Collection efficiency of epi-detection of the forward propagating signal as a function of sample thickness for tissue phantom (10% intralipid suspension) and mouse skin tissue. The focal volume was placed 1 μm deep in the tissue phantom for both measurements and calculations. Measurements are indicated by black dots, and Monte Carlo simulations of photon backscattering are indicated by the red squares. The experimental ratio was determined by normalizing the epi-detected signal from the tissue phantoms to forward-collected signal generated from water under the same excitation conditions. For the simulations, a scattering coefficient μs of 400 cm-1, a tissue absorption coefficient μa of 0.01 cm-1, and a scattering anisotropy g of 0.75 was used for intralipid (21). The blue triangles indicate the calculated results obtained for mouse skin tissue with μs = 150 cm-1, μa = 0.1 cm-1, and g = 0.85. More than 15% of the forward-generated CARS photons in mouse tissue are backscattered and collected by the objective.
Fig. 3.
Fig. 3.
Images of a hairless mouse ear. The Raman shift is set at 2,845 cm-1p = 816.8 nm) to address the lipid CH2 symmetric stretch vibration. The frames are averaged for 2 s. (A) Stratum corneum with bright signals from the lamellar lipid intercellular space that surrounds the polygonal corneocytes. Bright punctuated dots are ducts of sebaceous glands. (B) Sebaceous glands at ≈30 μm from skin surface. (C) Individual cells of the gland compartment can be recognized, with nuclei visible as dark holes (arrow). (D) Adipocytes of the dermis at ≈60 μm from skin surface. (E) Adipocytes of the subcutaneous layer at a depth of ≈100 μm. (F) 2D projection of 60 depth-resolved slices separated by 2 μm. Panels to the right and under F show the yz and xz cross sections taken at the white lines, respectively.
Fig. 4.
Fig. 4.
A combined sequential CARS and two-photon fluorescence tissue image. The CARS signal is colored blue, and the two-photon fluorescence is colored red. The Raman shift is set to 2,845 cm-1, with the 816.7-nm pump beam driving two-photon fluorescence excitation of the injected DiD dye. The sebaceous glands can be seen within the branched and looped capillary network.
Fig. 5.
Fig. 5.
Spectral differences between sebaceous glands and dermal adipocytes. (A) In vivo CARS spectrum of sebaceous gland (black) and adipocyte (red) obtained by point-by-point wavelength scanning of the pump beam. Note the dissimilarity in spectral intensity at higher wavenumbers (2,956 cm-1, indicated by arrow), caused by the different chemical lipid composition. (B) Ex vivo Raman spectrum of individual sebaceous glands (black) and adipocytes (red) recorded from 10-μm-thick microtomed tissue sections. We note that the CARS spectrum in the 2,900- to 2,970-cm-1 range offers more spectral sensitivity to the degree of saturation of aliphatic chains than the spontaneous Raman spectrum. (C and D) CARS image of a sebaceous gland at 2,845 cm-1 (C) and 2,956 cm-1 (D). (E and F) CARS image of adipocytes at 2,845 cm-1 (E) and 2,956 cm-1 (F).
Fig. 6.
Fig. 6.
Diffusion of mineral oil through mouse epidermis. (A) Externally applied mineral oil penetrates the stratum corneum through the lipid clefts between corneocytes. Image was taken ≈20 μm below the surface 15 min after application of the oil. Raman shift is set to 2,845 cm-1, yielding a bright signal from the oil. (B) The same area is shown 5 min later. Brighter signal indicates a higher oil concentration caused by time-dependent diffusion, which can be clearly seen during the 5-min time window.

Similar articles

Cited by

References

    1. Rajadhyaksha, M., Gonzalez, S., Zavislan, J. M., Anderson, R. R. & Webb, R. H. (1999) J. Invest. Dermatol. 113, 293-303. - PubMed
    1. Fujimoto, J. G. (2003) Nat. Biotechnol. 21, 1361-1367. - PubMed
    1. Masters, B. R. & So, P. T. C. (2001) Opt. Express 8, 2-10. - PubMed
    1. Zipfel, W. R., Williams, R. M., Christie, R., Nikitin, A. Y., Hyman, B. T. & Webb, W. W. (2003) Proc. Natl. Acad. Sci. USA 100, 7075-7080. - PMC - PubMed
    1. Campagnola, P. J. & Loew, L. M. (2003) Nat. Biotechnol. 21, 1356-1360. - PubMed

Publication types