Elevated telomere-telomere recombination in WRN-deficient, telomere dysfunctional cells promotes escape from senescence and engagement of the ALT pathway
- PMID: 16264192
- PMCID: PMC1276730
- DOI: 10.1101/gad.1321305
Elevated telomere-telomere recombination in WRN-deficient, telomere dysfunctional cells promotes escape from senescence and engagement of the ALT pathway
Abstract
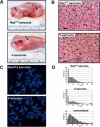
Werner Syndrome (WS) is characterized by premature aging, genomic instability, and cancer. The combined impact of WRN helicase deficiency and limiting telomere reserves is central to disease pathogenesis. Here, we report that cells doubly deficient for telomerase and WRN helicase show chromosomal aberrations and elevated recombination rates between telomeres of sister chromatids. Somatic reconstitution of WRN function, but not a WRN helicase-deficient mutant, abolished telomere sister chromatid exchange (T-SCE), indicating that WRN normally represses T-SCEs. Elevated T-SCE was associated with greater immortalization potential and resultant tumors maintained telomeres via the alternative lengthening of telomere (ALT) pathway. We propose that the increased incidence of chromosomal instability and cancer in WS relates in part to aberrant recombinations between sister chromatids at telomeres, which facilitates the activation of ALT and engenders cancer-relevant chromosomal aberrations and tumor formation.
Figures


Similar articles
-
Defective telomere lagging strand synthesis in cells lacking WRN helicase activity.Science. 2004 Dec 10;306(5703):1951-3. doi: 10.1126/science.1103619. Science. 2004. PMID: 15591207
-
Genetic cooperation between the Werner syndrome protein and poly(ADP-ribose) polymerase-1 in preventing chromatid breaks, complex chromosomal rearrangements, and cancer in mice.Am J Pathol. 2003 May;162(5):1559-69. doi: 10.1016/S0002-9440(10)64290-3. Am J Pathol. 2003. PMID: 12707040 Free PMC article.
-
Telomere dysfunction as a cause of genomic instability in Werner syndrome.Proc Natl Acad Sci U S A. 2007 Feb 13;104(7):2205-10. doi: 10.1073/pnas.0609410104. Epub 2007 Feb 6. Proc Natl Acad Sci U S A. 2007. PMID: 17284601 Free PMC article.
-
Role of Werner syndrome gene product helicase in carcinogenesis and in resistance to genotoxins by cancer cells.Cancer Sci. 2008 May;99(5):843-8. doi: 10.1111/j.1349-7006.2008.00778.x. Epub 2008 Feb 26. Cancer Sci. 2008. PMID: 18312465 Free PMC article. Review.
-
WRN at telomeres: implications for aging and cancer.J Cell Sci. 2007 Mar 1;120(Pt 5):713-21. doi: 10.1242/jcs.03397. J Cell Sci. 2007. PMID: 17314245 Review.
Cited by
-
Modified iPOND revealed the role of mutant p53 in promoting helicase function and telomere maintenance.Aging (Albany NY). 2023 Oct 12;15(19):10767-10784. doi: 10.18632/aging.205117. Epub 2023 Oct 12. Aging (Albany NY). 2023. PMID: 37827695 Free PMC article.
-
The Response to DNA Damage at Telomeric Repeats and Its Consequences for Telomere Function.Genes (Basel). 2019 Apr 24;10(4):318. doi: 10.3390/genes10040318. Genes (Basel). 2019. PMID: 31022960 Free PMC article. Review.
-
The telomere protein tankyrase 1 regulates DNA damage responses at telomeres.Aging (Albany NY). 2010 Oct;2(10):639-42. doi: 10.18632/aging.100221. Aging (Albany NY). 2010. PMID: 21076181 Free PMC article.
-
Mechanism and substrate specificity of telomeric protein POT1 stimulation of the Werner syndrome helicase.Nucleic Acids Res. 2008 Aug;36(13):4242-56. doi: 10.1093/nar/gkn385. Epub 2008 Jun 25. Nucleic Acids Res. 2008. PMID: 18583366 Free PMC article.
-
Depletion of Ku70/80 reduces the levels of extrachromosomal telomeric circles and inhibits proliferation of ALT cells.Aging (Albany NY). 2011 Apr;3(4):395-406. doi: 10.18632/aging.100308. Aging (Albany NY). 2011. PMID: 21512205 Free PMC article.
References
-
- Bailey S.M., Cornforth, M.N., Kurimasa, A., Chen, D.J., and Goodwin, E.H. 2001. Strand-specific postreplicative processing of mammalian telomeres. Science 293: 2462-2465. - PubMed
-
- Baerlocher G.M. and Lansdorp, P.M. 2004. Telomere length measurements using fluorescence in situ hybridization and flow cytometry. Methods Cell Biol. 75: 719-750. - PubMed
-
- Bechter O.E., Zou, Y., Walker, W., Wright, W.E., and Shay, J.W. 2004. Telomeric recombination in mismatch repair deficient human colon cancer cells after telomerase inhibition. Cancer Res. 64: 3444-3451. - PubMed
Publication types
MeSH terms
Substances
Grants and funding
LinkOut - more resources
Full Text Sources
Other Literature Sources
Molecular Biology Databases
