. 2005 Nov 2:5:98.
doi: 10.1186/1471-2334-5-98.

Cerebrospinal fluid HIV infection and pleocytosis: relation to systemic infection and antiretroviral treatment

Affiliations

Cerebrospinal fluid HIV infection and pleocytosis: relation to systemic infection and antiretroviral treatment

Serena S Spudich et al. BMC Infect Dis. .

Abstract

Background: Central nervous system (CNS) exposure to HIV is a universal facet of systemic infection. Because of its proximity to and shared barriers with the brain, cerebrospinal fluid (CSF) provides a useful window into and model of human CNS HIV infection.

Methods: Prospective study of the relationships of CSF to plasma HIV RNA, and the effects of: 1) progression of systemic infection, 2) CSF white blood cell (WBC) count, 3) antiretroviral therapy (ART), and 4) neurological performance. One hundred HIV-infected subjects were cross-sectionally studied, and 28 were followed longitudinally after initiating or changing ART.

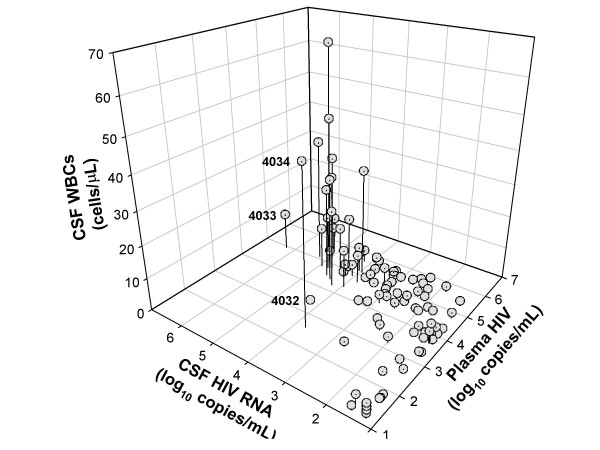
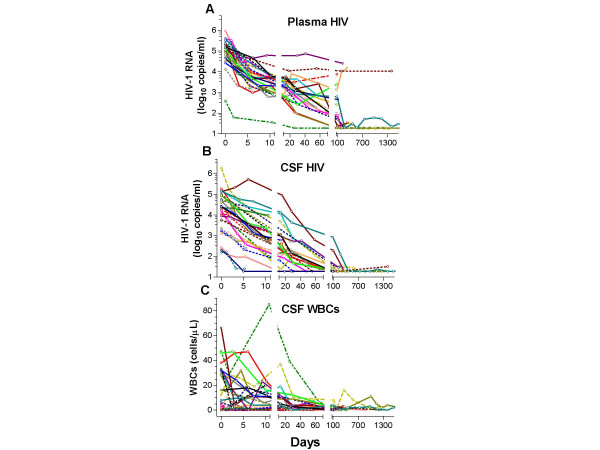
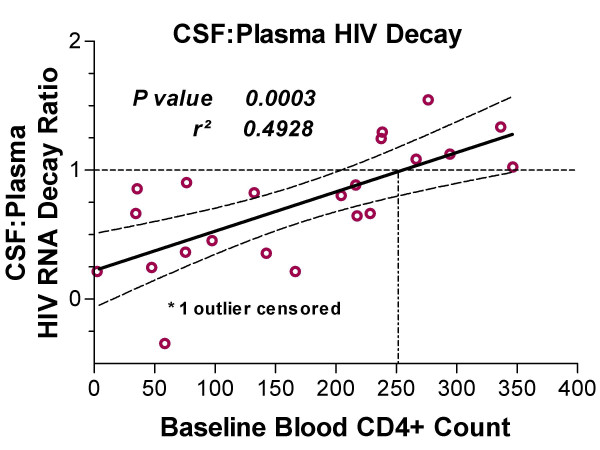
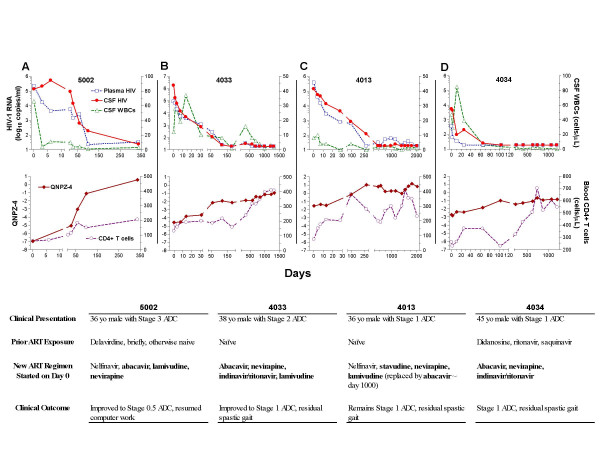
Results: In cross-sectional analysis, HIV RNA levels were lower in CSF than plasma (median difference 1.30 log10 copies/mL). CSF HIV viral loads (VLs) correlated strongly with plasma VLs and CSF WBC counts. Higher CSF WBC counts associated with smaller differences between plasma and CSF HIV VL. CSF VL did not correlate with blood CD4 count, but CD4 counts <50 cells/microL associated with a low prevalence of CSF pleocytosis and large differences between plasma and CSF VL. CSF HIV RNA correlated neither with the severity of the AIDS dementia complex (ADC) nor abnormal quantitative neurological performance, although these measures were associated with depression of CD4 counts. In subjects starting ART, those with lower CD4 counts had slower initial viral decay in CSF than in plasma. In all subjects, including five with persistent plasma viremia and four with new-onset ADC, CSF HIV eventually approached or reached the limit of viral detection and CSF pleocytosis resolved.

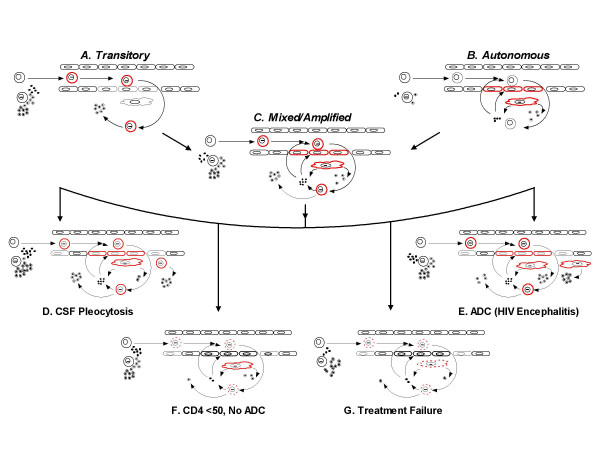
Conclusion: CSF HIV infection is common across the spectrum of infection and is directly related to CSF pleocytosis, though whether the latter is a response to or a contributing cause of CSF infection remains uncertain. Slowing in the rate of CSF response to ART compared to plasma as CD4 counts decline indicates a changing character of CSF infection with systemic immunological progression. Longer-term responses indicate that CSF infection generally responds well to ART, even in the face of systemic virological failure due to drug resistance. We present simple models to explain the differing relationships of CSF to plasma HIV in these settings.


Figures

Figure 1
Figure 1
Baseline distributions of HIV concentrations and CSF WBCs in relation to blood CD4 cell counts in the 100 subjects analyzed cross-sectionally. Individual panels show: (A) plasma HIV RNA, (B) CSF HIV RNA, and (C) CSF WBC counts in relation to blood CD4 counts. The vertical dotted lines in each panel separate the subjects into blood CD4 quartiles. The Symbol key appears in the bottom right panel, red boxes indicate patients off treatment, while blue circles indicate those on treatment.
Figure 2
Figure 2
Three-dimensional plot showing relationships among plasma and CSF HIV RNA concentrations and CSF WBC counts. Subjects with CSF pleocytosis had highest CSF VLs. In turn, higher CSF VLs were noted chiefly in those with elevated plasma HIV (>10,000 cpm). The numbers near three of the data points identify the three subjects with substantially higher CSF than plasma HIV RNA (see text).
Figure 3
Figure 3
Responses to ART. The panels show the individual subject plots of changes in the plasma (A) and CSF (B) HIV RNA concentrations and (C) WBC counts after treatment with the time axis broken into three segments showing initial, intermediate and longer-term outcomes.
Figure 4
Figure 4
Relation of CSF:plasma early-phase decay ratio to baseline blood CD4 cell counts. The regression line and 95% confidence intervals were plotted after censoring one subject with CD4 = 1,140 cells/μL. The p-value and r2 of this regression analysis are shown on the figure, while the results of nonparametric analysis are discussed in the text. The horizontal broken line designates the point at which plasma and CSF decay are equal (ratio of 1) and the vertical broken line signals the point where this crosses the regression line – near a blood CD4 count of 250 cells/μL.
Figure 5
Figure 5
Dissociated CSF and plasma HIV RNA responses in five subjects. Each of these subjects achieved near or full CSF viral suppression despite an incomplete plasma response. The top panels of each pair show CSF and blood HIV RNA and CSF WBC values (A). The lower panels graphically depict the phenotypic resistance profiles as fold change in susceptibility to the drugs these subjects were taking during the study compared to reference wild type on a log10 scale [26]. See the text for discussion.
Figure 6
Figure 6
Longitudinal follow-up of four subjects presenting with new-onset or progressing ADC. The upper panel of each pair shows the plasma and CSF VL responses along with CSF WBC changes, and the lower panels show treatment effects on the QNPZ-4 scores and the blood CD4 counts. The table below each graph indicates clinical features of each respective subject. Antiretroviral medications considered able to penetrate the CSF [10] are indicated in bold font. The key to the symbols for all graphs are shown to the left of panel set (A).
Figure 7
Figure 7
Model of CSF HIV infection. The diagram provides a simple schematic of hematogenous infection with T cells (including HIV-infected CD4 cells) and intrathecal macrophages separated by the blood-brain endothelial barrier. The model presumes that virus reaches the CNS principally within infected cells. T cells are shown as round cells, either infected (bar within nucleus) or uninfected (no bar). Similarly, the macrophages are shown as flat, elongated cells with or without infection (again, bar in nucleus). Both virus (circles with central dot) and cytokine/chemokine (smaller solid circles) are produced or provoked by infection on both sides of the barrier. Cells particularly involved in the illustrated process are highlighted in red and also may show thickened outline when active and broken line when the action is attenuated. Panels A, B, and C presents a simplified schematic of two basic types of CSF infection, transitory and autonomous, along with a combination of these types in mixed or amplified infection. Panels D-G apply these models to the relationships of plasma and CSF HIV (Δplasma:CSF) in four of the settings described in this report, including D. the high Δplasma:CSF in subjects with pleocytosis >10 cells/μL related to exuberant transitory infection; E the high Δplasma:CSF in ADC patients due to enhanced autonomous infection; F. the low Δplasma:CSF in subjects with < 50 blood CD4 cells/μL related to reduced transitory infection; and G the low Δplasma:CSF in treatment failures also related to decreased transitory infection.

References

    1. Navia BA, Jordan BD, Price RW. The AIDS dementia complex: I. Clinical Features. Ann Neurol. 1986;19:517–524. doi: 10.1002/ana.410190602. - DOI - PubMed
    1. Marshall DW, Brey RL, Cahill WT, Houk RW, Zajac RA, Boswell RN. Spectrum of cerebrospinal fluid findings in various stages of human immunodeficiency virus infection. Arch Neurol. 1988;45:954–958. - PubMed
    1. McArthur JC, Cohen BA, Farzadegan H, Cornblath DR, Selnes OA, Ostrow D, Johnson RT, Phair J, Polk BF. Cerebrospinal fluid abnormalities in homosexual men with and without neuropsychiatric findings. Ann Neurol. 1988;23(suppl):S34–S37. doi: 10.1002/ana.410230712. - DOI - PubMed
    1. Brew BJ, Pemberton L, Cunningham P, Law MG. Levels of human immunodeficiency virus type 1 RNA in cerebrospinal fluid correlate with AIDS dementia stage. J Inf Dis. 1997;175:963–966. - PubMed
    1. Pilcher CD, Shugars DC, Fiscus SA, Miller WC, Menezes P, Giner J, Dean B, Robertson K, Hart CE, Lennox JL, Eron JJJ, Hicks CB. HIV in body fluids during primary HIV infection: implications for pathogenesis, treatment and public health. Aids. 2001;15:837–845. doi: 10.1097/00002030-200105040-00004. - DOI - PubMed

Publication types