Comparative Study
. 2005 Nov 2;25(44):10131-7.
doi: 10.1523/JNEUROSCI.3244-05.2005.

Breakdown of long-range temporal correlations in theta oscillations in patients with major depressive disorder

Affiliations
Comparative Study

Breakdown of long-range temporal correlations in theta oscillations in patients with major depressive disorder

Klaus Linkenkaer-Hansen et al. J Neurosci. .

Abstract

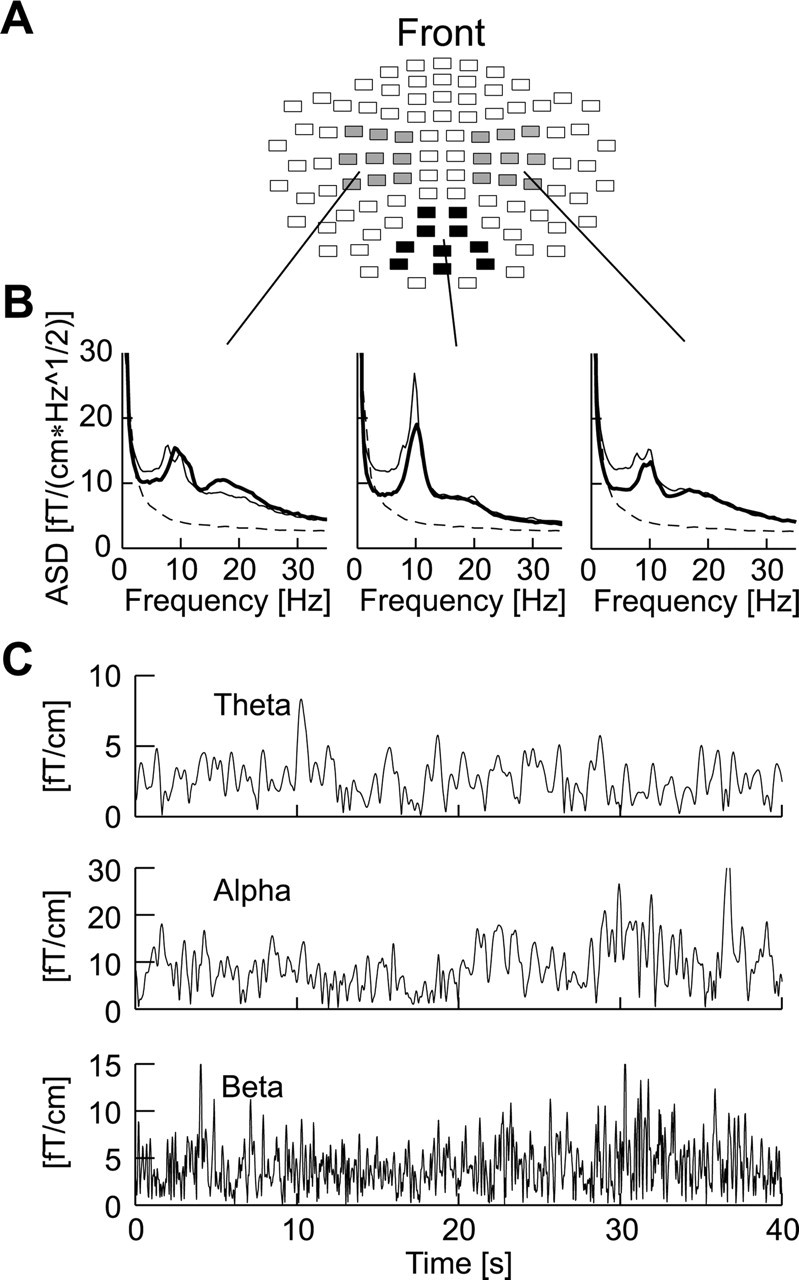
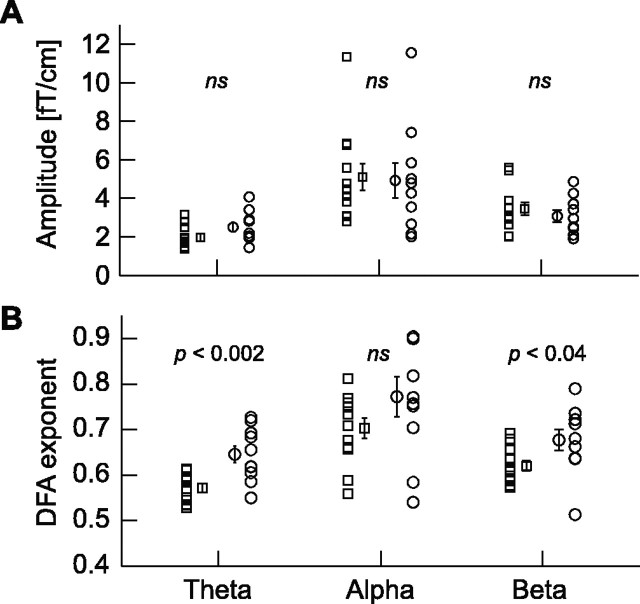
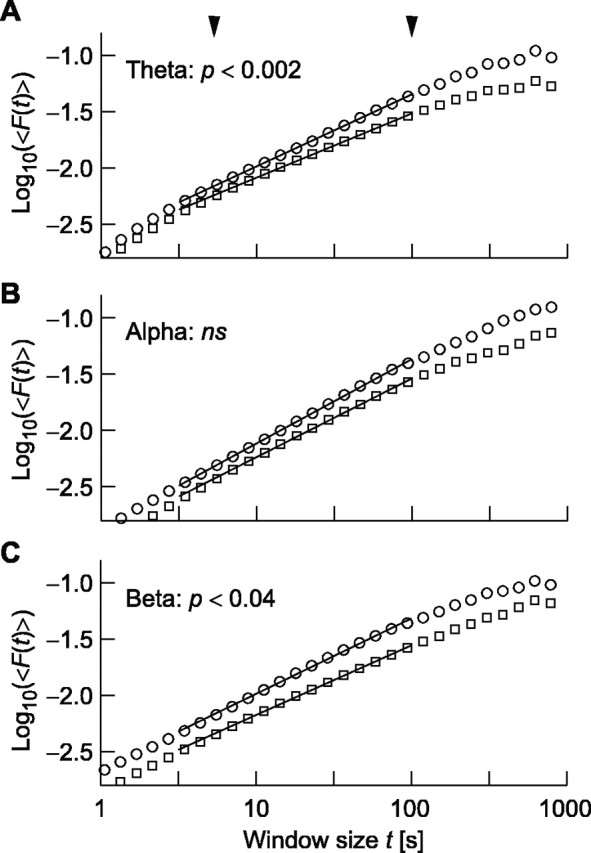
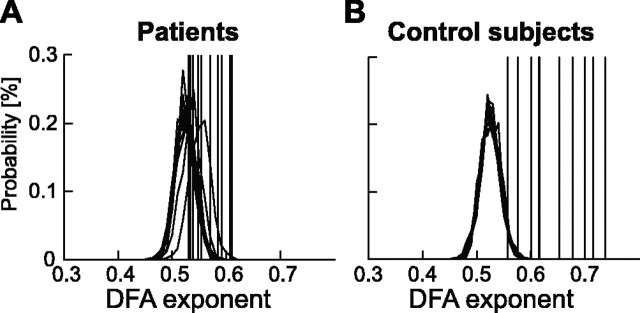
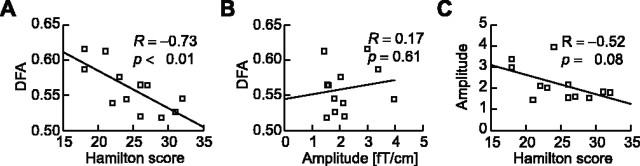
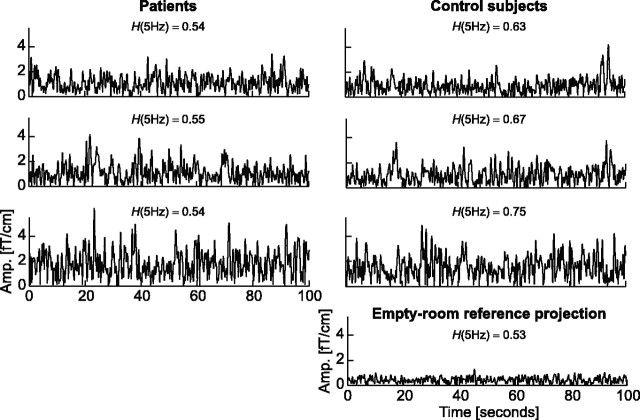
Neuroimaging has revealed robust large-scale patterns of high neuronal activity in the human brain in the classical eyes-closed wakeful rest condition, pointing to the presence of a baseline of sustained endogenous processing in the absence of stimulus-driven neuronal activity. This baseline state has been shown to differ in major depressive disorder. More recently, several studies have documented that despite having a complex temporal structure, baseline oscillatory activity is characterized by persistent autocorrelations for tens of seconds that are highly replicable within and across subjects. The functional significance of these long-range temporal correlations has remained unknown. We recorded neuromagnetic activity in patients with a major depressive disorder and in healthy control subjects during eyes-closed wakeful rest and quantified the long-range temporal correlations in the amplitude fluctuations of different frequency bands. We found that temporal correlations in the theta-frequency band (3-7 Hz) were almost absent in the 5-100 s time range in the patients but prominent in the control subjects. The magnitude of temporal correlations over the left temporocentral region predicted the severity of depression in the patients. These data indicate that long-range temporal correlations in theta oscillations are a salient characteristic of the healthy human brain and may have diagnostic potential in psychiatric disorders. We propose a link between the abnormal temporal structure of theta oscillations in the depressive patients and the systems-level impairments of limbic-cortical networks that have been identified in recent anatomical and functional studies of patients with major depressive disorder.


Figures

Figure 1.
Figure 1.
Channel selections and ongoing oscillations. A, The position of channels that covered the left and right temporocentral (gray) and occipitoparietal (black) regions are shown on a flattened view of the helmet-shaped sensor array. Each rectangle represents two joint planar gradiometers. B, The grand averaged amplitude spectral density (ASD) of the signal-space projections in the three regions indicate a considerable level of ongoing activity in the theta-(3-7 Hz), alpha-(7-13 Hz), and beta-frequency bands (15-29 Hz) in both patients (thick lines) and control subjects (thin lines) compared with the noise level in the MEG system (thin dashed lines). C, The oscillations in the theta-, alpha-, and beta-frequency bands exhibit large-amplitude variability on time scales of hundreds of milliseconds to tens of seconds.
Figure 2.
Figure 2.
Intersubject variability of amplitudes and DFA exponents. For each oscillation, averaged across locations (occipitoparietal and left and right temporocentral regions), the individual mean amplitudes (A) and exponents (B) are shown for patients (squares) and controls (circles). The mean ± SEM is plotted next to the individual values.
Figure 3.
Figure 3.
The detrended fluctuation analysis reveals an abnormal temporal correlation structure in theta and beta oscillations in depressive patients. B, The grand averages of the DFA in occipitoparietal and left and right temporocentral cortices show that patients (squares) and controls (circles) have nearly identical scaling and autocorrelation properties for the alpha-band oscillations. A, C, Theta and beta oscillations, however, have a faster decay of correlations as indicated by smaller slopes of the DFA function versus time window in the double-logarithmic coordinates. The curves have been vertically offset for the purpose of visualization. The arrow-heads mark the interval used for determining the DFA exponents.
Figure 4.
Figure 4.
Surrogate data analysis indicates an almost complete lack of long-range temporal correlations in the theta oscillations of depressive patients. A, B, The scaling exponents (averaged across locations) of the original theta oscillation time series (indicated with vertical lines) are mostly indistinguishable from the probability distribution of DFA exponents from 500 surrogate data sets from each subject in depressive patients (A), whereas normal control subjects fall clearly outside the central part of the distributions (B).
Figure 5.
Figure 5.
The severity of depression is reflected in DFA power-law scaling exponents of theta oscillations. A, B, The DFA exponents of left temporocentral theta oscillations are correlated with the Hamilton score of depression (A) but not with the amplitude of these oscillations (B). C, Moreover, the amplitude of the theta oscillations does not predict the severity of the depression.
Figure 6.
Figure 6.
Control subjects have “hidden” fractal patterns that are essentially absent in depressive patients. The amplitude fluctuations of the theta oscillations in the left temporocentral region over the course of 100 s are displayed for three representative patients (left column) and control subjects (right column). Despite the quantitative difference between subjects, it is not possible to identify a qualitative difference between the two groups by visual inspection. The DFA exponents (H) of the chosen individuals are indicated above the time series. The empty-room reference recording is shown to indicate the noise level at ∼5 Hz.

References

    1. Austin M-P, Mitchell P, Goodwin GM (2001) Cognitive deficits in depression: possible implications for functional neuropathology. Br J Psychiatry 178: 200-206. - PubMed
    1. Bruns A, Eckhorn R, Jokeit H, Ebner A (2000) Amplitude envelope correlation detects coupling among incoherent brain signals. NeuroReport 11: 1509-1514. - PubMed
    1. Buzsáki G (2002) Theta oscillations in the hippocampus. Neuron 33: 325-340. - PubMed
    1. Buzsáki G, Draguhn A (2004) Neuronal oscillations in cortical networks. Science 304: 1926-1929. - PubMed
    1. Campbell S, Marriott M, Nahmias C, MacQueen GM (2004) Lower hippocampal volume in patients suffering from depression: a meta-analysis. Am J Psychiatry 161: 598-607. - PubMed

Publication types

LinkOut - more resources