. 2006 Jan;17(1):1-13.
doi: 10.1091/mbc.e05-09-0824. Epub 2005 Nov 2.

Molecular interaction maps of bioregulatory networks: a general rubric for systems biology

Affiliations

Molecular interaction maps of bioregulatory networks: a general rubric for systems biology

Kurt W Kohn et al. Mol Biol Cell. 2006 Jan.

Abstract

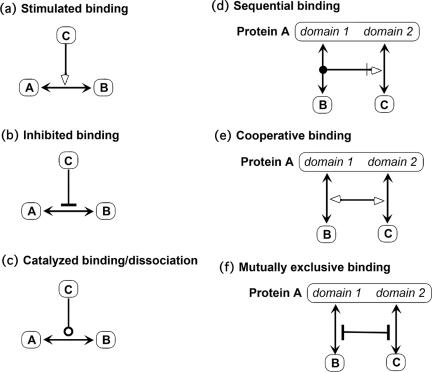
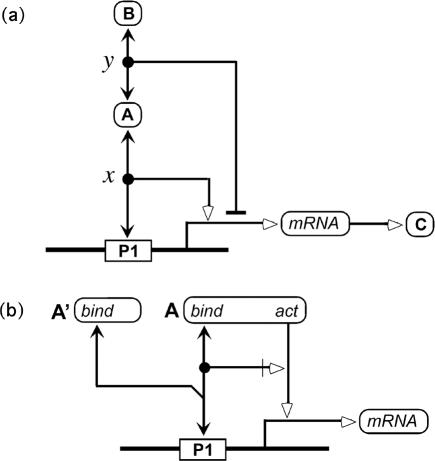
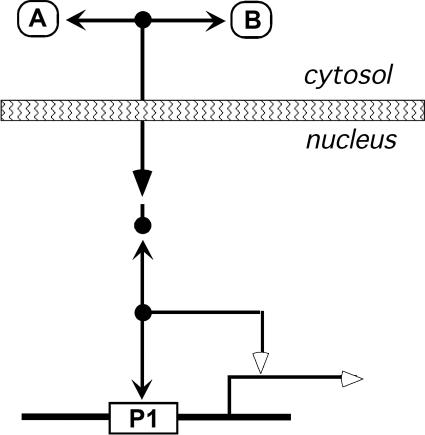
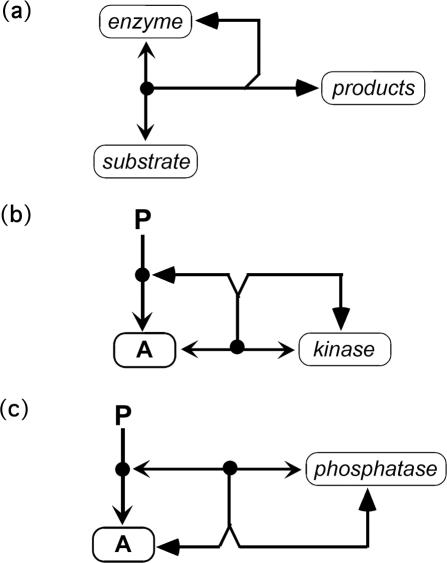
A standard for bioregulatory network diagrams is urgently needed in the same way that circuit diagrams are needed in electronics. Several graphical notations have been proposed, but none has become standard. We have prepared many detailed bioregulatory network diagrams using the molecular interaction map (MIM) notation, and we now feel confident that it is suitable as a standard. Here, we describe the MIM notation formally and discuss its merits relative to alternative proposals. We show by simple examples how to denote all of the molecular interactions commonly found in bioregulatory networks. There are two forms of MIM diagrams. "Heuristic" MIMs present the repertoire of interactions possible for molecules that are colocalized in time and place. "Explicit" MIMs define particular models (derived from heuristic MIMs) for computer simulation. We show also how pathways or processes can be highlighted on a canonical heuristic MIM. Drawing a MIM diagram, adhering to the rules of notation, imposes a logical discipline that sharpens one's understanding of the structure and function of a network.


Figures

Figure 1.
Figure 1.
Molecular interaction symbols. Interactions are of two types: reactions (a– h) and contingencies (i–l). Reactions operate on (point to) molecular species, whereas contingencies operate on reactions or on other contingencies. (a) Noncovalent (reversible) binding is indicated by a line with barbed arrowheads at both ends. (b) Covalent modification is indicated by a single barbed arrowhead pointing to the modification site. (c) Stoichiometric reaction (reactants converted to a corresponding number of product molecules) is indicated by a filled triangle arrowhead. This symbol can be used also for translocation events, because molecules disappear from one location and reappear in another location, logically the equivalent of a stoichiometric reaction. (d) Production of a molecular species without loss of macromolecular reactants (as in transcription or translation) is indicated by an open triangle arrowhead pointing to a molecular species. (Small ubiquitous molecules, such as ATP, can usually be ignored.) (e) Production by transcription is indicated by an open triangle at the end of a hooked line. (f) Cleavage of a covalent bond is indicated by a zigzag symbol. (g) Degradation is indicated by a filled triangle pointing to a null symbol (stoichiometric conversion to debris). (h) Reaction between different molecules of the same type (reaction in trans) is indicated by a gap symbol in the interaction line. (i) Stimulation of a process is indicated by an open triangle arrowhead pointing to an interaction line. (j) If the stimulating agent is a requirement, a bar is added behind the open triangle arrowhead. (k) Inhibition is indicated by a bar at the end of the interaction line. (l) Enzymatic catalysis is indicated by an open circle at the end of the interaction line.
Figure 2.
Figure 2.
Molecular species symbols. Elementary molecular species are those that are named (a– c). Complex molecular species are created as a consequence of interactions and are indicated by small circles (“nodes”) placed on an interaction line (d– g). (a) The name of a protein or RNA may occur within a cartouche. (b) Alternatively, the cartouche may contain domain names. Domain names are listed in N- to C-terminal order from left to right; the protein name then is placed adjacent to the left end of the cartouche. (c) Nucleotide sequence elements (e.g., promoter elements) are placed in a box. (d) Multimers are indicated by nodes placed on binding interaction lines: (e) Modified (e.g., phosphorylated) species are indicated by nodes placed on the modification line. Thus, a node on a phosphorylation line represents the phosphorylated molecule (i.e., the consequence of the interaction). (f) An isolated filled circle (node) at the end of an interaction line represents another copy of the molecular species represented at the other end of the line. Thus, x represents another copy of A, and y represents the A:A homodimer, which is the consequence of the interaction. (g) A node on a line without arrowheads indicates the consequence of the combined effect of the nodes at the ends of the line (see Figures 3d and 5i for examples).
Figure 3.
Figure 3.
Binding interactions. (a) Multiple binding to the same molecule. B and C bind different sites on A. (b) Mutually exclusive binding (different sites, allosteric). (c) Competitive binding (same site). Nodes x and y represent the A:B and A:C dimers, respectively. Node z represents A bound to B or C. (The angle at the branch leading to B and C should be <90° to avoid suggesting that B can bind to C.) Node w represents D bound to A:B or A:C. (d) Domain-specific binding. B and C bind protein A at domains-1 and -2, respectively; D binds protein A, but it is not known to which domain. Node w represents A with B bound to domain 1 and C bound to domain 2. (e) Intramolecular binding. Binding between domains-1 and -2 within the same molecule (binding in cis). The node represents protein A containing this intramolecular bond. (f) Intermolecular binding between indicated domains in a homodimer: domains-1 and -2 in different molecules of the same type binding in trans to form a homodimer (represented by the node).
Figure 4.
Figure 4.
Contingencies of binding. (a) C stimulates binding between A and B (or inhibits dissociation of the A:B complex). (b) C inhibits A:B binding (mechanism unspecified). (c) C catalyzes the formation and dissociation of the A:B complex (reducing the energy barrier of the A:B interaction). (d) Sequential binding: B must bind to domain 1 before C can bind to domain 2. (e) Cooperative binding: binding of B to domain 1 increases the affinity of C for domain 2, and vice versa. (f) Mutually exclusive binding: protein A can bind B at domain 1 or C at domain 2, but not both at the same time (allosteric interference).
Figure 5.
Figure 5.
Covalent modifications and their contingencies. (a) Phosphorylation by a protein kinase. Similarly for acetylation (Ac), methylation (Me), ubiquitination (Ub), myristoylation (Myr), and so on. The amino acid site of modification can be indicated as a superscript (as in this figure) or between the protein cartouche and the arrowhead (as in example Figure 5j). (b) Removal of a phosphate by a protein phosphatase. (c) Binding-contingent phosphorylation: B must bind to domain 1 before site-1 can be phosphorylated. (d) Inhibited phosphorylation: binding of B inhibits phosphorylation of site-1. (e) Phosphorylation of site-1 stimulates binding of B to domain 1. (f) Phosphorylation of site-1 inhibits binding of B to domain 1. (g) Sequential phosphorylation: site-1 must be phosphorylated before site-2 can be phosphorylated. (h) Phosphorylation of site-1 inhibits phosphorylation of site-2. (i) State-combination: x and y are protein A phosphorylated at sites-1 and -2, respectively; z is A phosphorylated at both sites. (j) Alternative modifications of the same site: lysine-100 (K100) can be either acetylated or ubiquitinated.
Figure 6.
Figure 6.
Kinase phosphorylation cascade. (a) Contingency notation. (b) Compact notation.
Figure 7.
Figure 7.
Compound contingencies: full notation (left); abbreviated notation (right). A gap in a contingency line in the abbreviated notation is interpreted as if the line jumps over the subsequent nodes.
Figure 8.
Figure 8.
Control of transcription. (a) Stimulation of transcription by protein A and inhibition of transcription by protein B because its recruitment to the promoter via binding to protein A. (b) Actions of DNA binding and transcription activation domains of protein A. Protein A′ is a truncated variant of protein A that retains the DNA binding domain, but lacks the activation domain. It therefore competes with protein A for binding to the promoter but cannot activate transcription (thereby functioning as a transcription inhibitor).
Figure 9.
Figure 9.
Translocation from cytosol to nucleus. A binds B in the cytosol. The A:B complex translocates to the nucleus (indicated by filled-triangle arrowhead). The translocated A:B, which is represented using the isolated node abbreviation, binds to the promoter and stimulates transcription. The optional short line attached to the isolated node can guard against misreading the diagram (see text).
Figure 10.
Figure 10.
Control by cleavage between interacting domains in the same protein. In this example, domain 1 inhibits the ability of domain 2 to bind protein B. The inhibition is abrogated by a specific protease that cleaves protein A at a site that separates the two domains. Two notations for this situation are shown. In a, the inhibitory effect of domain 1 is shown explicitly, and the effect of cleavage, namely, to reverse the inhibition, is implied by the fact that cleavage separates the two domains. In b, the cause of the inhibition of binding of protein B is not shown explicitly. Instead, the cleavage between the two domain is indicated to have the consequence of stimulating the binding of protein B to domain 2 (and may or may not have anything to do with domain 1).
Figure 11.
Figure 11.
Interactions at membranes: signaling via G-proteins. This classic signaling pathway is here shown in MIM notation. See text for detailed description and discussion.
Figure 12.
Figure 12.
Intramolecular control of protein kinase activity: CaMK, a classic pathway shown here in MIM notation. See text for description and discussion.
Figure 13.
Figure 13.
Intramolecular covalent binding: reactions of SH groups in response to reactive oxygen (Temple et al., 2005). See text for description and discussion.
Figure 14.
Figure 14.
Pathways highlighted on a canonical map (MIM): from ATM to p53. Shown are four pathways by which ATM can increase the amount of transcriptionally active p53. (a) ATM phosphorylates p53; this phosphorylation blocks the binding of p53 to Mdm2, thereby preventing rapid MdM2-induced p53 degradation. (b) Another effect of ATM-induced p53 phosphorylation is to stimulate the binding of p53 to p300 (which probably competes with Mdm2 for p53 binding). p300 then acetylates p53, thereby stimulating p53 binding to the promoter and activating transcription. (c) ATM phosphorylates Mdm2, thereby blocking p53:Mdm2 binding and p53 degradation, as in a. (d) ATM phosphorylates Chk2 Thr68, thereby simulating Chk2 autophosphorylation of Ser516, which activates Chk2. Chk2 can then phosphorylate p53, with consequences similar to a and b.
Figure 15.
Figure 15.
Explicit notation of enzymatic reactions. (a) General schema showing reversible production of enzyme-substrate complex and its conversion to products. The filled-triangle arrowheads signify a stoichiometric conversion. (b) Protein kinase mechanism. Protein A binds kinase reversibly, and the resulting complex is stoichiometrically converted to phospho-A and regenerated kinase. (c) Protein phosphatase mechanism. Phospho-A binds phosphatase reversibly, and the resulting complex is stoichiometrically converted to unphosphorylated-A and regenerated phosphatase.

References

    1. Aladjem, M. I., Pasa, S., Parodi, S., Weinstein, J. N., Pommier, Y., and Kohn, K. W. (2004). Molecular interaction maps–a diagrammatic graphical language for bioregulatory networks. Sci STKE 2004, pe8. - PubMed
    1. Cook, D. L., Farley, J. F., and Tapscott, S. J. (2001). A basis for a visual language for describing, archiving and analyzing functional models of complex biological systems. Genome Biol. 2, RESEARCH0012. - PMC - PubMed
    1. Corney, D. P., Buxton, B. F., Langdon, W. B., and Jones, D. T. (2004). BioRAT: extracting biological information from full-length papers. Bioinformatics 20, 3206 –3213. - PubMed
    1. Funahashi, A., Morohashi, M., and Kitano, H. (2003). CellDesigner: a process diagram editor for gene-regulatory and biochemical networks. Biosilico 1, 159 –162.
    1. Gagneur, J., Krause, R., Bouwmeester, T., and Casari, G. (2004). Modular decomposition of protein-protein interaction networks. Genome Biol. 5, R57. - PMC - PubMed

Publication types

LinkOut - more resources