

Cell type-specific characterization of nuclear DNA contents within complex tissues and organs
- PMID: 16270943
- PMCID: PMC1277020
- DOI: 10.1186/1746-4811-1-7
Cell type-specific characterization of nuclear DNA contents within complex tissues and organs
Abstract
Background: Eukaryotic organisms are defined by the presence of a nucleus, which encloses the chromosomal DNA, and is characterized by its DNA content (C-value). Complex eukaryotic organisms contain organs and tissues that comprise interspersions of different cell types, within which polysomaty, endoreduplication, and cell cycle arrest is frequently observed. Little is known about the distribution of C-values across different cell types within these organs and tissues.
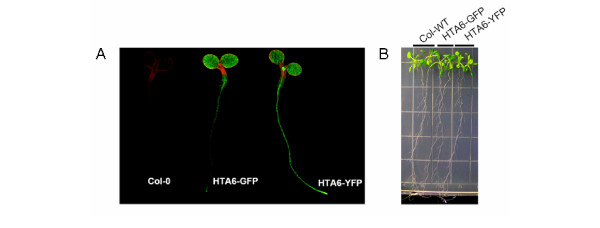
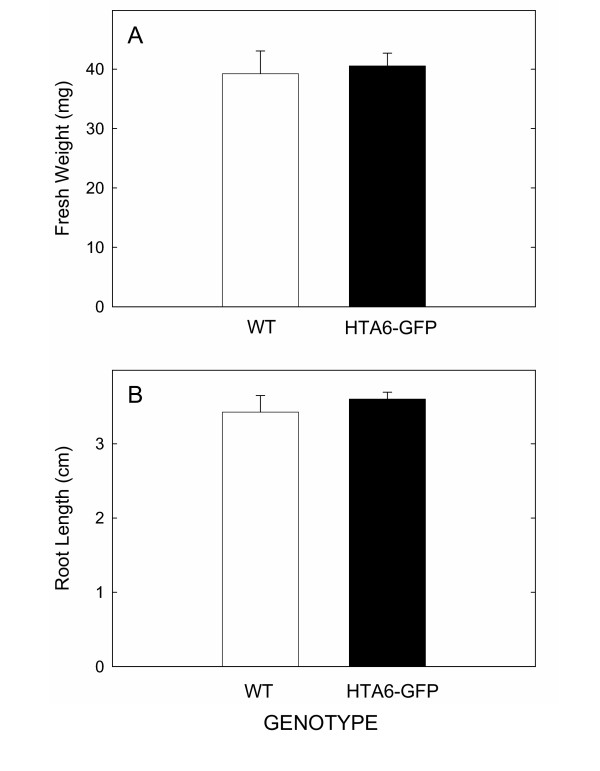
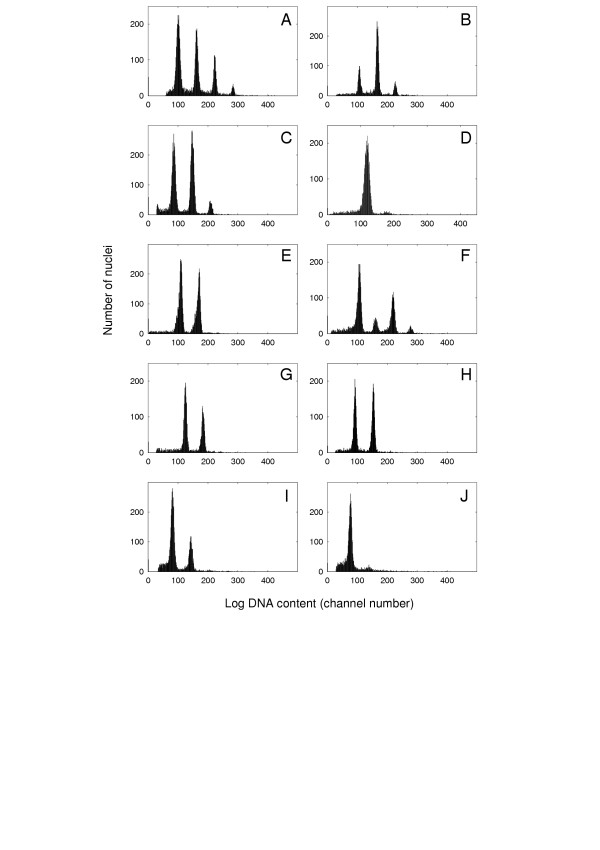
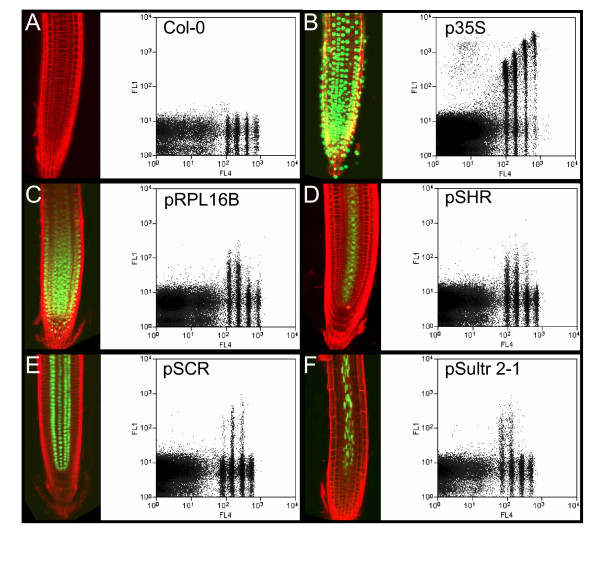
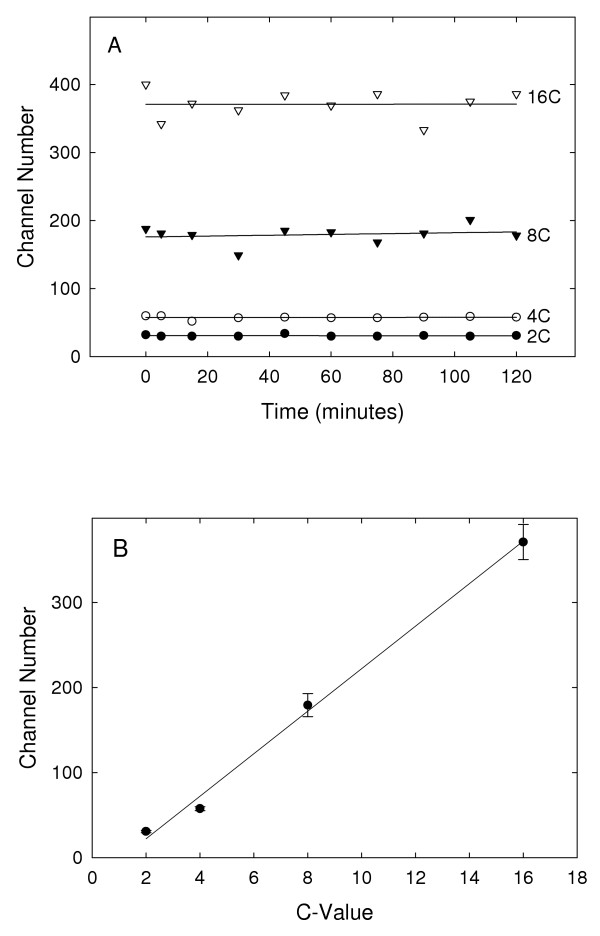
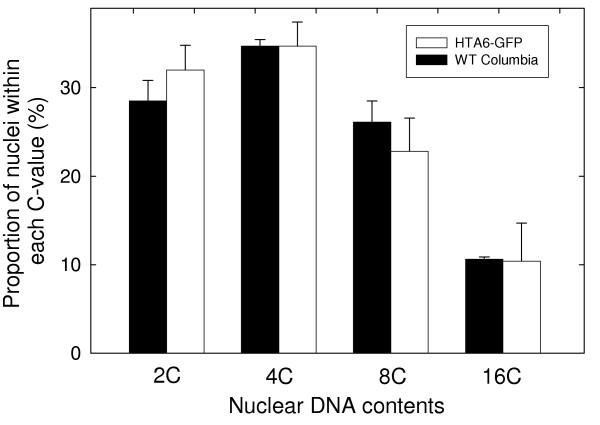
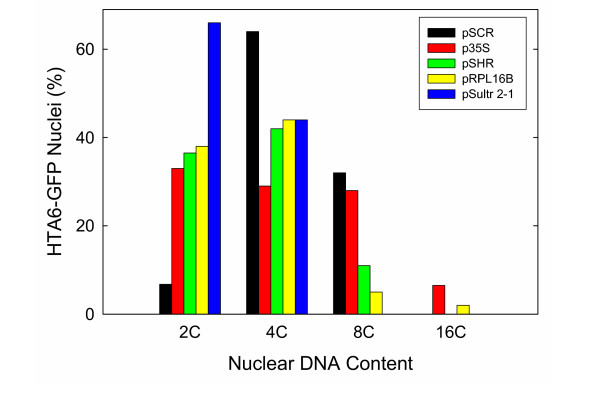
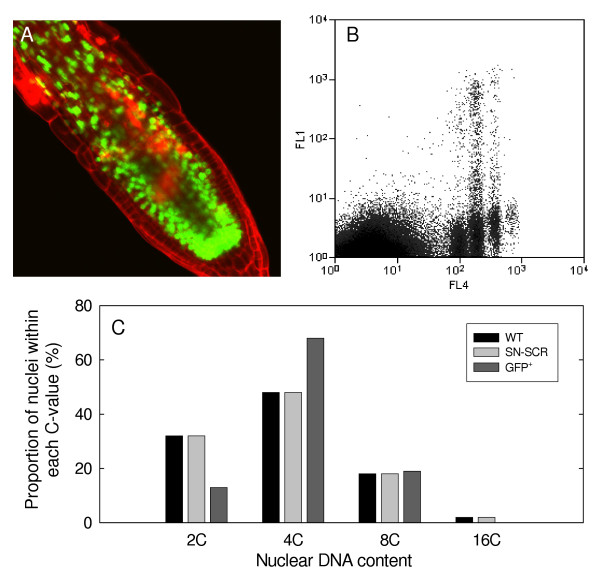
Results: We have developed, and describe here, a method to precisely define the C-value status within any specific cell type within complex organs and tissues of plants. We illustrate the application of this method to Arabidopsis thaliana, specifically focusing on the different cell types found within the root.
Conclusion: The method accurately and conveniently charts C-value within specific cell types, and provides novel insight into developmental processes. The method is, in principle, applicable to any transformable organism, including mammals, within which cell type specificity of regulation of endoreduplication, of polysomaty, and of cell cycle arrest is suspected.
Figures
Similar articles
-
Endoreduplicative standards for calibration of flow cytometric C-Value measurements.Cytometry A. 2014 Apr;85(4):368-74. doi: 10.1002/cyto.a.22440. Epub 2014 Jan 10. Cytometry A. 2014. PMID: 24415326
-
Nuclear Cytometry: Analysis of the Patterns of DNA Synthesis and Transcription Using Flow Cytometry, Confocal Microscopy, and RNA Sequencing.Methods Mol Biol. 2018;1678:371-392. doi: 10.1007/978-1-4939-7346-0_16. Methods Mol Biol. 2018. PMID: 29071687
-
On the relationship between endoreduplication and collet hair initiation and tip growth, as determined using six Arabidopsis thaliana root-hair mutants.J Exp Bot. 2015 Jun;66(11):3285-95. doi: 10.1093/jxb/erv136. Epub 2015 Apr 4. J Exp Bot. 2015. PMID: 25873686
-
Multiparametric analysis, sorting, and transcriptional profiling of plant protoplasts and nuclei according to cell type.Methods Mol Biol. 2011;699:407-29. doi: 10.1007/978-1-61737-950-5_20. Methods Mol Biol. 2011. PMID: 21116995 Review.
-
Tubulin-Based DNA Barcode: Principle and Applications to Complex Food Matrices.Genes (Basel). 2019 Mar 18;10(3):229. doi: 10.3390/genes10030229. Genes (Basel). 2019. PMID: 30889932 Free PMC article. Review.
Cited by
-
A New Set of Golden-Gate-Based Organelle Marker Plasmids for Colocalization Studies in Plants.Plants (Basel). 2022 Oct 5;11(19):2620. doi: 10.3390/plants11192620. Plants (Basel). 2022. PMID: 36235483 Free PMC article.
-
Analysis of Xylem Cells by Nucleus-Based Transcriptomics and Chromatin Profiling.Methods Mol Biol. 2024;2722:67-78. doi: 10.1007/978-1-0716-3477-6_5. Methods Mol Biol. 2024. PMID: 37897600
-
Control of vein-forming, striped gene expression by auxin signaling.BMC Biol. 2021 Sep 24;19(1):213. doi: 10.1186/s12915-021-01143-9. BMC Biol. 2021. PMID: 34556094 Free PMC article.
-
RNA interference-mediated gene knockdown within specific cell types.Plant Mol Biol. 2012 Sep;80(2):169-76. doi: 10.1007/s11103-012-9937-7. Epub 2012 Jun 28. Plant Mol Biol. 2012. PMID: 22740284
-
Decipher the Molecular Response of Plant Single Cell Types to Environmental Stresses.Biomed Res Int. 2016;2016:4182071. doi: 10.1155/2016/4182071. Epub 2016 Mar 20. Biomed Res Int. 2016. PMID: 27088086 Free PMC article. Review.
References
-
- Barow M, Meister A. Endopolyploidy in seed plants is differently correlated to systematics, organ, life strategy and genome size. Plant Cell Envir. 2003;26:571–584. doi: 10.1046/j.1365-3040.2003.00988.x. - DOI
-
- Galbraith DW, Harkins KR, Maddox JR, Ayres NM, Sharma DP, Firoozabady E. Rapid flow cytometric analysis of the cell cycle in intact plant tissues. Science. 1983;220:1049–1051. - PubMed
LinkOut - more resources
Full Text Sources
