

Non-random nature of spontaneous mIPSCs in mouse auditory brainstem neurons revealed by recurrence quantification analysis
- PMID: 16271982
- PMCID: PMC1599776
- DOI: 10.1098/rspb.2005.3258
Non-random nature of spontaneous mIPSCs in mouse auditory brainstem neurons revealed by recurrence quantification analysis
Erratum in
- Proc Biol Sci. 2006 Dec 22;273(1605):3133
Abstract
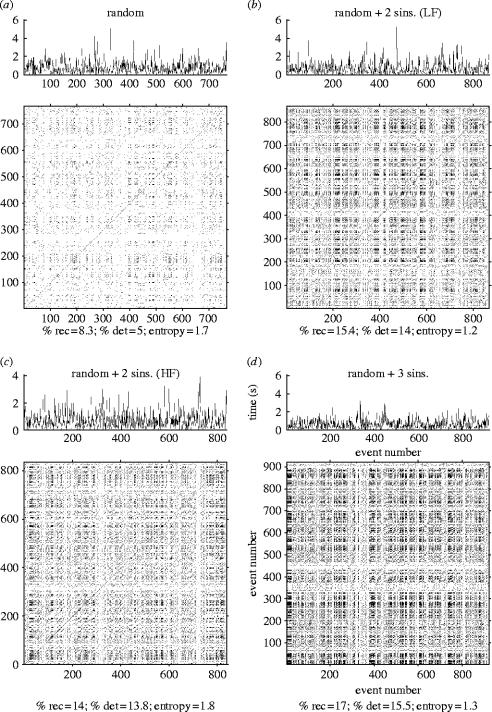
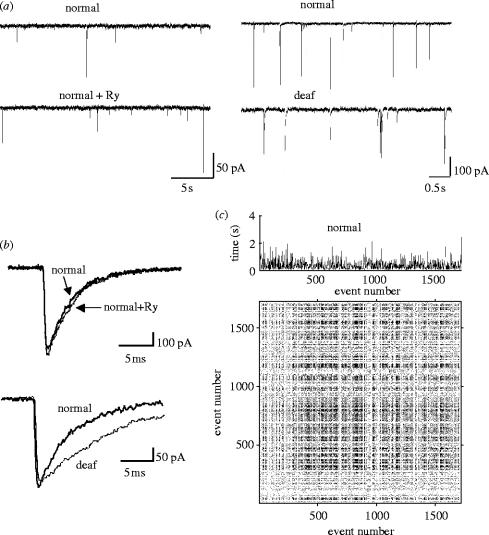
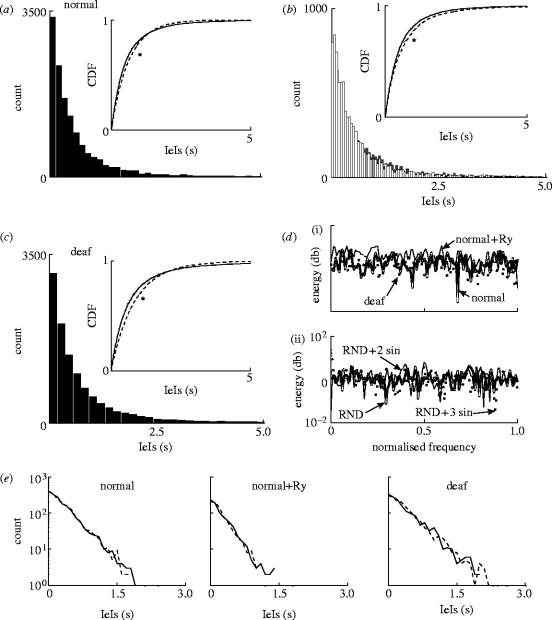
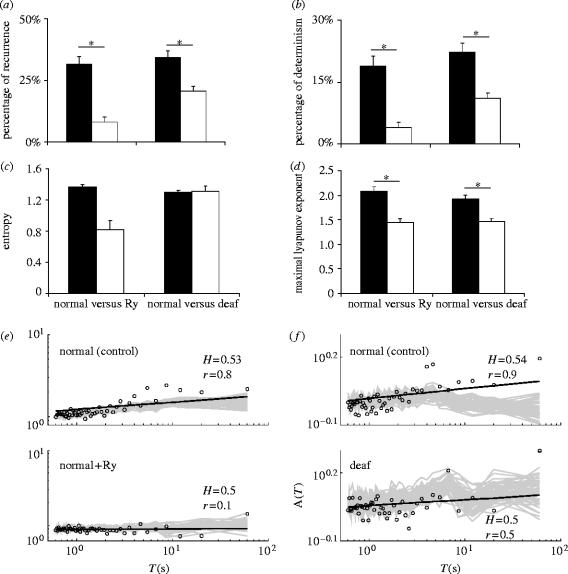
A change in the spontaneous release of neurotransmitter is a useful indicator of processes occurring within presynaptic terminals. Linear techniques (e.g. Fourier transform) have been used to analyse spontaneous synaptic events in previous studies, but such methods are inappropriate if the timing pattern is complex. We have investigated spontaneous glycinergic miniature synaptic currents (mIPSCs) in principal cells of the medial nucleus of the trapezoid body. The random versus deterministic (or periodic) nature of mIPSCs was assessed using recurrence quantification analysis. Nonlinear methods were then used to quantify any detected determinism in spontaneous release, and to test for chaotic or fractal patterns. Modelling demonstrated that this procedure is much more sensitive in detecting periodicities than conventional techniques. mIPSCs were found to exhibit periodicities that were abolished by blockade of internal calcium stores with ryanodine, suggesting calcium oscillations in the presynaptic inhibitory terminals. Analysis indicated that mIPSC occurrences were chaotic in nature. Furthermore, periodicities were less evident in congenitally deaf mice than in normal mice, indicating that appropriate neural activity during development is necessary for the expression of deterministic chaos in mIPSC patterns. We suggest that chaotic oscillations of mIPSC occurrences play a physiological role in signal processing in the auditory brainstem.
Figures
Similar articles
-
Glycinergic mIPSCs in mouse and rat brainstem auditory nuclei: modulation by ruthenium red and the role of calcium stores.J Physiol. 2003 Feb 1;546(Pt 3):691-9. doi: 10.1113/jphysiol.2002.035071. J Physiol. 2003. PMID: 12562997 Free PMC article.
-
Differences in glycinergic mIPSCs in the auditory brain stem of normal and congenitally deaf neonatal mice.J Neurophysiol. 2004 Feb;91(2):1006-12. doi: 10.1152/jn.00771.2003. Epub 2003 Oct 15. J Neurophysiol. 2004. PMID: 14561690
-
[Modulation of extracellular calcium on miniature inhibitory postsynaptic currents of Xenopus' optic tectal neurons].Sheng Li Xue Bao. 2003 Oct 25;55(5):599-606. Sheng Li Xue Bao. 2003. PMID: 14566411 Chinese.
-
Effects of various K+ channel blockers on spontaneous glycine release at rat spinal neurons.Brain Res. 2007 Jul 9;1157:11-22. doi: 10.1016/j.brainres.2006.09.097. Epub 2007 Jun 6. Brain Res. 2007. PMID: 17555723
-
Presynaptic calcium stores and synaptic transmission.Curr Opin Neurobiol. 2005 Jun;15(3):275-81. doi: 10.1016/j.conb.2005.05.003. Curr Opin Neurobiol. 2005. PMID: 15919193 Review.
Cited by
-
Synchronization through nonreciprocal connections in a hybrid hippocampus microcircuit.Front Neural Circuits. 2013 Jul 23;7:120. doi: 10.3389/fncir.2013.00120. eCollection 2013. Front Neural Circuits. 2013. PMID: 23888129 Free PMC article.
-
Fractal dimension of EEG activity senses neuronal impairment in acute stroke.PLoS One. 2014 Jun 26;9(6):e100199. doi: 10.1371/journal.pone.0100199. eCollection 2014. PLoS One. 2014. PMID: 24967904 Free PMC article.
-
Circadian Rhythms in Fractal Features of EEG Signals.Front Physiol. 2018 Nov 12;9:1567. doi: 10.3389/fphys.2018.01567. eCollection 2018. Front Physiol. 2018. PMID: 30483146 Free PMC article.
-
Modeling the Effect of Temperature on Membrane Response of Light Stimulation in Optogenetically-Targeted Neurons.Front Comput Neurosci. 2020 Feb 4;14:5. doi: 10.3389/fncom.2020.00005. eCollection 2020. Front Comput Neurosci. 2020. PMID: 32116619 Free PMC article.
-
Strength-duration relationship for intra- versus extracellular stimulation with microelectrodes.Neuroscience. 2012 Jul 12;214(5):1-13. doi: 10.1016/j.neuroscience.2012.04.004. Epub 2012 Apr 16. Neuroscience. 2012. PMID: 22516015 Free PMC article.
References
-
- Bacchereti, M. 2004 Analisi quantitativa delle recurrence plots: RQA2 in: Sviluppo di modelli non lineari per l'analisi di segnali elettroencefalografici. Ph.D. thesis, Universita di Pisa.
-
- Bock G.R, Frank M.P, Steel K.P. Preservation of central auditory function in the deafness mouse. Brain Res. 1982;39:608–612. 10.1016/0006-8993(82)90536-4 - DOI - PubMed
-
- Collin T, Marty A, Llano I. Presynaptic calcium stores and synaptic transmission. Curr. Opin. Neurobiol. 2005;15:275–281. 10.1016/j.conb.2005.05.003 - DOI - PubMed
Publication types
MeSH terms
Substances
LinkOut - more resources
Full Text Sources
Medical
