. 2005 Nov 15;102(46):16880-5.
doi: 10.1073/pnas.0508202102. Epub 2005 Nov 4.

Revealing the large-scale network organization of growth hormone-secreting cells

Affiliations

Revealing the large-scale network organization of growth hormone-secreting cells

Xavier Bonnefont et al. Proc Natl Acad Sci U S A. .

Abstract

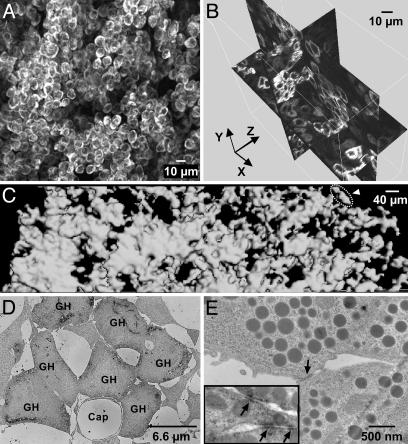
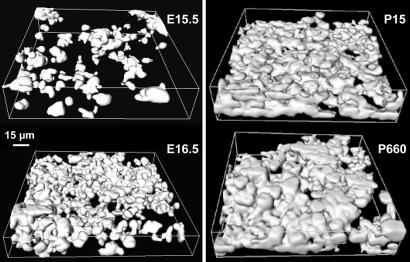
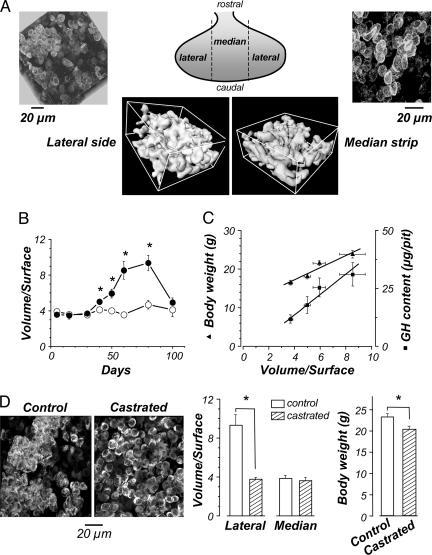
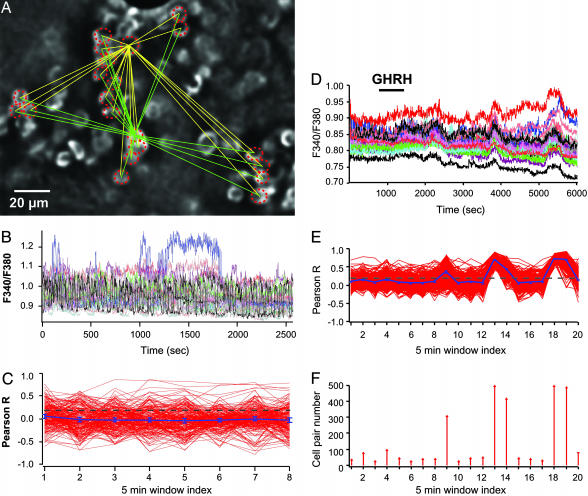
Pituitary growth hormone (GH)-secreting cells regulate growth and metabolism in animals and humans. To secrete highly ordered GH pulses (up to 1,000-fold rise in hormone levels in vivo), the pituitary GH cell population needs to mount coordinated responses to GH secretagogues, yet GH cells display an apparently heterogeneous scattered distribution in 2D histological studies. To address this paradox, we analyzed in 3D both positioning and signaling of GH cells using reconstructive, two-photon excitation microscopy to image the entire pituitary in GH-EGFP transgenic mice. Our results unveiled a homologous continuum of GH cells connected by adherens junctions that wired the whole gland and exhibited the three primary features of biological networks: robustness of architecture across lifespan, modularity correlated with pituitary GH contents and body growth, and connectivity with spatially stereotyped motifs of cell synchronization coordinating cell activity. These findings change our view of GH cells, from a collection of dispersed cells to a geometrically connected homotypic network of cells whose local morphology and connectivity can vary, to alter the timing of cellular responses to promote more coordinated pulsatile secretion. This large-scale 3D view of cell functioning provides a powerful approach to identify and understand other networks of endocrine cells that are thought to be scattered in situ. Many dispersed endocrine systems exhibit pulsatile outputs. We suggest that cell positioning and associated cell-cell connection mechanisms will be critical parameters that determine how well such systems can deliver a coordinated secretory pulse of hormone to their target tissues.


Figures

Fig. 1.
Fig. 1.
Three-dimensional continuum of the GH cell population. (A) Two-photon image stack (70-μm thickness) taken from an intact GH-GFP mouse pituitary. For a sample movie, see Movie 1. (B) Shown is 3D orthogonal slicing of a two-photon image stack (80-μm thickness). (C) Surface rendering of GH-GFP cell contours from four juxtaposed two-photon image stacks (30-μm thickness) covering the distance from the dorsal (left) to the ventral (right) sides of a GH-GFP pituitary. The cell contours were almost all in close contact to each other (automatic detection procedure), except a small cell group (surrounded by a dashed line, arrowhead). (D and E) Mice were fixed with glutaraldehyde after a procedure that scattered cells with loose contacts. (D) Electron micrograph of a cluster of contacting GH cells stained with a GH antibody (labeled as GH). (E) Representative electron micrograph of a contact zone (arrow) between two GH cells. (Inset) Contact zones between GH cells stained with a β-catenin antibody (arrows).
Fig. 2.
Fig. 2.
Cell positioning continuously leads GH cells to form a cell continuum across the mouse's lifespan. Surface rendering of GH-GFP cell contours from two-photon image stacks of GH-GFP pituitaries. Animal ages are indicated on the right of 3D representations of GH cell positioning (E, embryos; P, postnatal).
Fig. 3.
Fig. 3.
Developmental modularity of the GH system architecture. (A) Shown are 3D reconstructions (Upper) and surface rendering views (Lower) of two-photon image stacks of the GH cell system architecture in both lateral (Left) and median (Right) regions of a 60-day-old male GH-EGFP pituitary. The calculated V/S ratios of surface rendering views in lateral and median zones were 7.7 and 3.8, respectively. (B)V/S ratios in both lateral (•) and median (○) regions vs. mice age. (C) V/S ratios in lateral regions (30- to 60-day-old males) vs. body weight (▴; linear regression: y = 10.88 + 1.57x, R = 0.96, P = 0.04) and GH content (▪; linear regression: y = 1.03 + 3.42x, R = 0.93, P = 0.03). (D) (Left) Shown are 3D reconstructions of the GH system architecture in lateral regions of two 60-day-old males either sham-operated (control) or castrated at 15 days old. (Center)V/S ratios in both lateral and median regions from 60-day-old sham-operated (open columns) and castrated (hatched columns) male pituitaries. (Right) Body weights of 60-day-old sham-operated (open columns) and castrated (hatched columns) males. *, P < 0.001.
Fig. 4.
Fig. 4.
GHRH triggers recurrent motifs of GH cell connectivity in the lateral zones. (A) Field of GH cells labeled with EGFP in the lateral zone. Only cells circled with a dashed line were also loaded with the fluorescent calcium dye fura-2. (B) Representative traces of spontaneous calcium spikes due to electrical activity. (C) Linear correlation (Pearson R) between calcium recordings among all cell pairs (C1-C2, C1-C3,... CN-1-CN) taken every 5 min. The yellow and green lines (A) illustrate the potent cell pairs for two recorded GH cells. Although some cell pairs displayed high R values, no large-scale cell connectivity (P < 0.001) was observed during spontaneous calcium spiking. (D-F) GHRH (10 nM) was applied during a 15-min time period (horizontal bar). (D) GHRH triggered a complex, oscillating calcium response in GH-EGFP cells recorded in the lateral zone. (E) Recurrent motifs of connectivity among large cell ensembles were observed in lateral regions (P < 0.001). (F) Distribution of numbers of connected cell pairs vs. time of calcium recording. GHRH triggered a delayed, cycling increase in connected cell pairs.
Fig. 5.
Fig. 5.
GHRH triggers sustained changes in GH cell connectivity in the median zone. (A-D) GHRH (10 nM) was applied during a 15-min time period (horizontal bar). (A) GHRH triggered a prolonged change in calcium spiking activity. (B)Cross-correlation (Pearson R) between cell pairs. Arrows indicate cell pairs with high R values after GHRH application (P < 0.001). (C) Numbers of cell pairs with significant cell connectivity (P < 0.001). Paradoxically, GHRH also caused a delayed decrease in the numbers of connected cell pairs (P < 0.05). (D-F) Changes in both calcium spike firing and cell connectivity (Pearson R) in a pair of neighboring GH cells before (D), during (E), and after (F) GHRH application. The cell pair corresponded to a trace marked by an arrow in B.

References

    1. Kostyo, J. L. & Goodman, H. M. (1999) Hormonal Control of Growth (Oxford Univ. Press, Oxford).
    1. Asa, S. L. & Ezzat, S. (2002) Nat. Rev. Cancer 2, 836-849. - PubMed
    1. Bowers, C. Y., Reynolds, G. A., Durham, D., Barrera, C. M., Pezzoli, S. S. & Thorner, M. O. (1990) J. Clin. Endocrinol. Metab. 70, 975-982. - PubMed
    1. Clarke, R. G. & Robinson, I. C. A. F. (1985) Nature 106, 281-289.
    1. Tannenbaum, G. S. & Martin, J. B. (1976) Endocrinology 98, 562-570. - PubMed

Publication types