

Comparison of a low carbohydrate-low fiber diet and a moderate carbohydrate-high fiber diet in the management of feline diabetes mellitus
- PMID: 16275041
- PMCID: PMC10832676
- DOI: 10.1016/j.jfms.2005.08.004
Comparison of a low carbohydrate-low fiber diet and a moderate carbohydrate-high fiber diet in the management of feline diabetes mellitus
Abstract
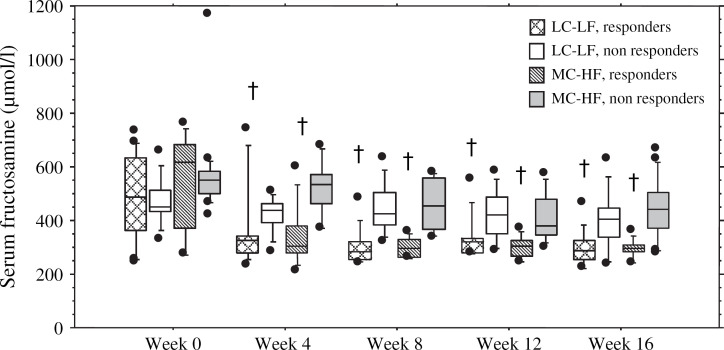
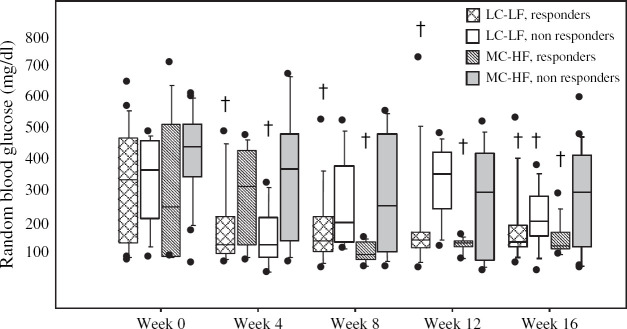
This study compared the effects of a moderate carbohydrate-high fiber (MC-HF) food and a low carbohydrate-low fiber (LC-LF) food on glycemic control in cats with diabetes mellitus. Sixty-three diabetic cats (48 male castrated, 15 female spayed) were randomly assigned to be fed either a canned MC-HF (n = 32) food or a canned LC-LF (n = 31) food for 16 weeks. Owners were blinded to the type of diet fed. CBC, urinalysis, serum chemistry panel, fructosamine concentration and thyroxine concentration were determined on initial examination, and a complete blood count, serum chemistry panel, urinalysis and serum fructosamine concentration were repeated every 4 weeks for 16 weeks. Insulin doses were adjusted as needed to resolve clinical signs and lower serum fructosamine concentrations. Serum glucose (P = 0.0001) and fructosamine (P = 0.0001) concentrations significantly decreased from week 0 to week 16 in both dietary groups. By week 16, significantly more of the cats fed the LC-LF food (68%, 22/31), compared to the cats fed the MC-HF food (41%, 13/32), had reverted to a non-insulin-dependent state (P = 0.03). Cats in both groups were successfully taken off of insulin regardless of age, sex, type of insulin administered or duration of clinical disease before entering the study. There was no significant difference in the initial or final mean body weights or in the mean change in body weight from week 0 to week 16 between dietary groups. Diabetic cats in this study were significantly more likely to revert to a non-insulin-dependent state when fed the canned LC-LF food versus the MC-HF food.
Figures
References
-
- Anderson J.W., Akanji A.O. Dietary fiber – an overview, Diabetes Care 14, 1991, 1126–1131. - PubMed
-
- Biourge V., Nelson R.W., Feldman E.C., Willits N.H., Morris J.G., Rogers Q.R. Effect of weight gain and subsequent weight loss on glucose intolerance and insulin response in healthy cats, Journal of Veterinary Internal Medicine 11, 1997, 86–91. - PubMed
-
- Miller J.C. Brand, Colagiuri S. The carnivore connection: dietary carbohydrate in the evolution of NIDDM, Diabetologia 37, 1994, 1280–1286. - PubMed
-
- Carlstead K., Brown J.L., Strawn W. Behavioral and physiological correlates of stress in laboratory cats, Applied Animal Behavioral Science 38, 1993, 143–158.
Publication types
MeSH terms
Substances
LinkOut - more resources
Full Text Sources
Medical
Research Materials
Miscellaneous
