. 2005 Nov 7;202(9):1271-8.
doi: 10.1084/jem.20051018.

CD4 T cells integrate signals delivered during successive DC encounters in vivo

Affiliations

CD4 T cells integrate signals delivered during successive DC encounters in vivo

Susanna Celli et al. J Exp Med. .

Abstract

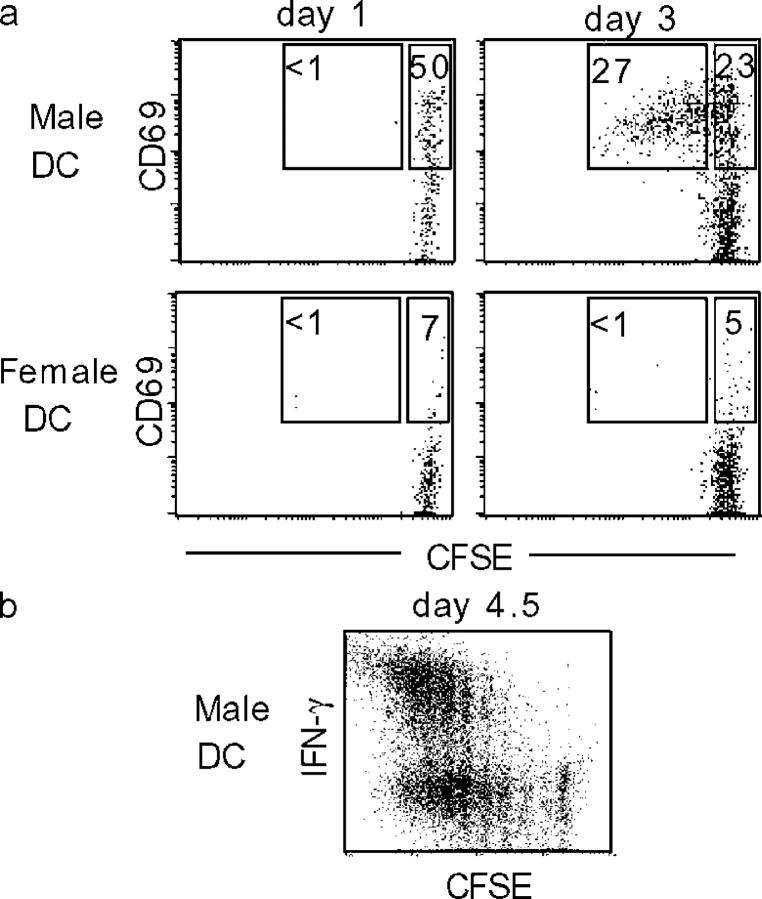
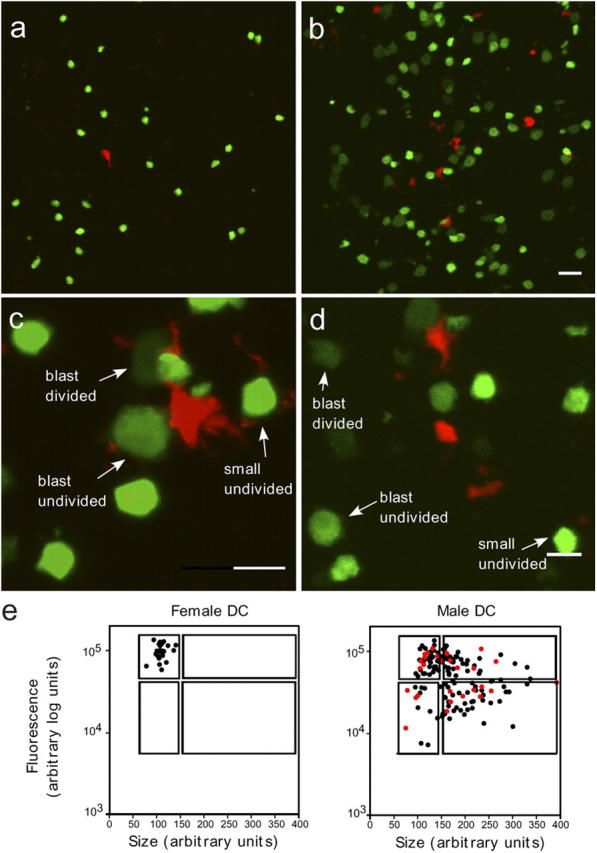
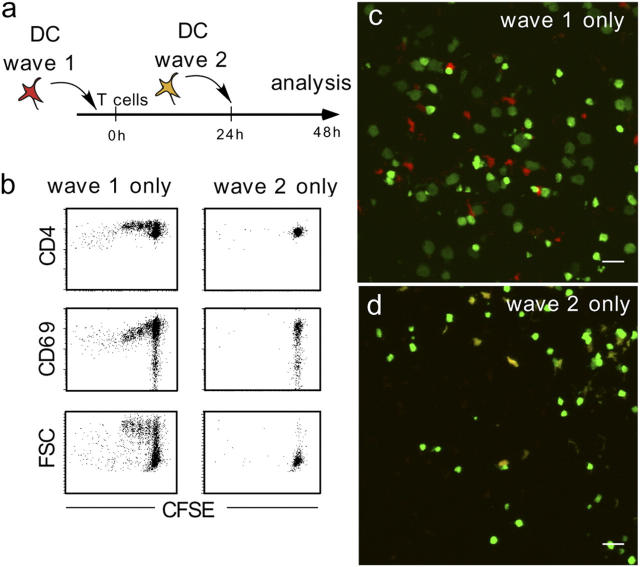
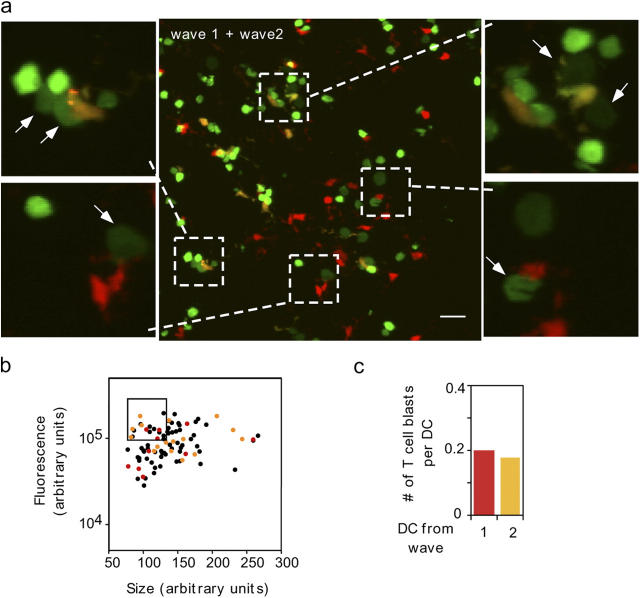
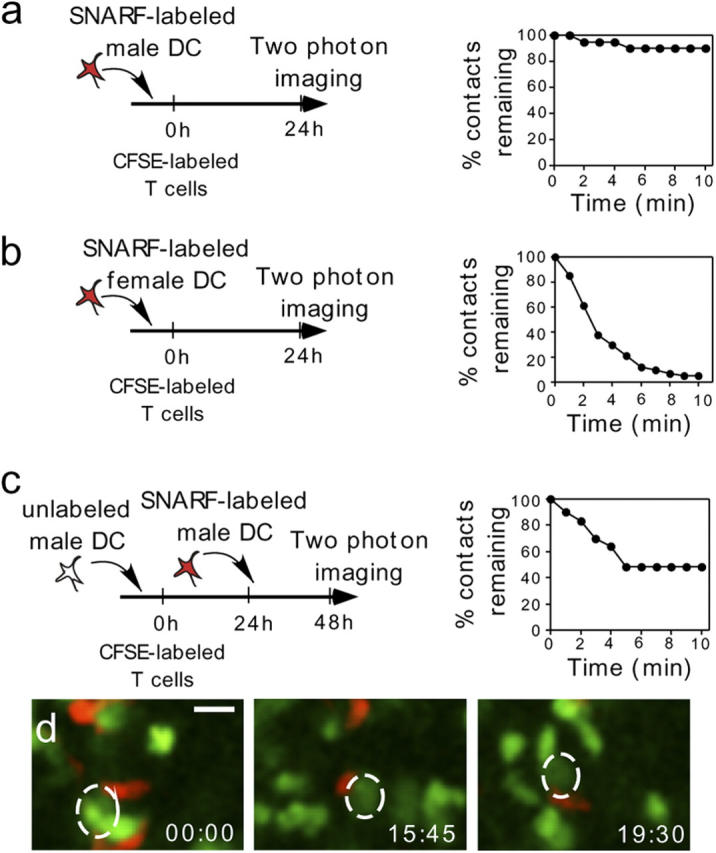
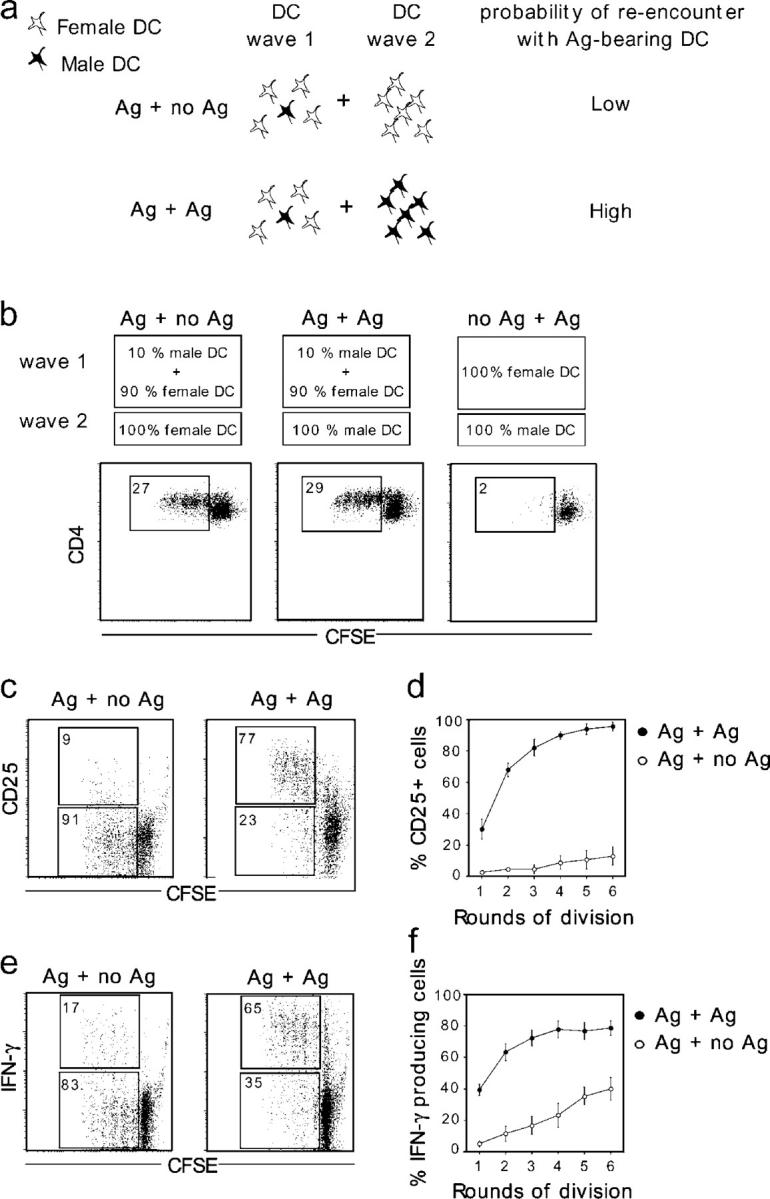
The cellular mode of T cell priming in vivo remains to be characterized fully. We investigated the fate of T cell-dendritic cell (DC) interactions in the late phase of T cell activation in the lymph node. In general, CD4 T cells detach from DCs before undergoing cell division. Using a new approach to track the history of antigen (Ag)-recognition events, we demonstrated that activated/divided T cells reengage different DCs in an Ag-specific manner. Two-photon imaging of intact lymph nodes suggested that T cells could establish prolonged interactions with DCs at multiple stages during the activation process. Importantly, signals that are delivered during subsequent DC contacts are integrated by the T cell and promote sustained IL-2Ralpha expression and IFN-gamma production. Thus, repeated encounters with Ag-bearing DCs can occur in vivo and modulate CD4 T cell differentiation programs.


Figures

Figure 1.
Figure 1.
CD4 T cell activation upon injection of Ag-bearing DCs. (a) DCs (2 × 10⁶) from male or female mice were injected i.d. in the inguinal region. CFSE-labeled anti-HY Marylin (CD45.1+) CD4 T cells (3 × 10⁶) were injected i.v. At various time points, the inguinal lymph node was harvested. The extent of T cell proliferation and the expression of the CD69 activation marker were measured by flow cytometry. Data are gated on CD4+CD45.1+ lymphocytes. Numbers indicate the percentage of cells falling into the indicated region. (b) IFN-γ production by Marylin T cells was measured by intracellular staining on day 4.5 after 4 h of culture in the presence of the Dby peptide.
Figure 2.
Figure 2.
Tracking T cell–DC interactions in the late stage of priming. (a and b) Visualizing the hallmark of T cell activation. Inguinal lymph nodes were harvested and sectioned 48 h after injection of CFSE-labeled Marylin T cells and SNARF-labeled DCs that were derived from female (a) or male (b) mice. Marylin T cells (green); DC (red). Bar, 20 μm. (c) Example of a confocal image (maximum projection of a Z-stack of images) of a lymph node section showing a small undivided T cell, an undivided T cell blast, and a divided T cell blast contacting a male DC (red). Note that undivided T cell blasts appear dimmer when compared with small, undivided T cells because of dilution of the CFSE content in a larger cell volume. Bar, 10 μm. (d) T cells making no apparent contact with Ag-bearing DCs. Bar, 10 μm. (e) The size and the total fluorescent amount of individual T cells was determined as described in the Materials and methods section. Individual Marylin T cells that contacted a labeled DC are shown as red dots, otherwise they are shown as black dots. Regions delimiting four distinct T cell populations based on their size (small cells versus blasts) and division status (undivided versus divided) are shown.
Figure 3.
Figure 3.
Kinetics of CD4 T cell blastogenesis and division. (a) Experimental design. Recipient mice were adoptively transferred with 107 CFSE-labeled Marylin T cells and received one or two of the following i.d. injections: injection 1 performed on day 0 with 2 × 10⁶ SNARF-labeled male DCs, and injection 2 performed at 24 h with 2 × 10⁶ male DCs labeled with a mixture of CFSE and SNARF dyes. Draining inguinal lymph nodes were harvested at 48 h. (b) Lymph node cells from recipients that received the first or second DC injection only were analyzed by flow cytometry. Data are gated on CD4+CD45.1+ lymphocytes. (c and d) Lymph nodes from recipients that received the first (c) or the second (d) DC injection only were sectioned and processed for confocal imaging. Marylin T cells (green); DCs from wave 1 (red); DCs from wave 2 (orange). The presence of large undivided T cell blasts and divided T cells was not seen at the time of analysis in recipient mice that received the second DC injection only. Bars, 20 μm.
Figure 4.
Figure 4.
CD4 T cells can engage several DCs successively. Recipient mice were adoptively transferred with 107 CFSE-labeled Marylin T cells. 2 × 10⁶ SNARF-labeled male DCs were injected i.d. on day 0, and 2 × 10⁶ male DCs that were labeled with a mixture of SNARF and CFSE dyes were injected on day 1. At 48 h, the draining lymph node was harvested, sectioned, and processed for confocal microscopy. (a) Marylin T cells (green), DCs from the first injection (red), and DCs from the second injection (orange). Bar, 20 μm. Note that blast T cells (white arrows) interact with DCs from both waves. (b) The size and fluorescence content of individual T cells was measured. Individual T cells that interacted with a DC from the first injection are shown as red dots, those that interacted with DCs from the second injection are shown as orange dots, and those that made no apparent contact with injected DCs are shown as black dots. A region delimiting the size and fluorescence of naive T cells is shown. (c) Data compiled from three representative lymph node sections are displayed. The number of T cell blasts (divided or undivided) that contacted DCs from each wave was calculated from six lymph node sections. A total of 178 (wave 1) and 258 (wave 2) DCs was analyzed. Similar results were obtained in two independent experiments.
Figure 5.
Figure 5.
CD4 T cells can establish prolonged interactions with DCs at multiple stages during the activation process. (a and b) T cell–DC contacts at 24 h. Recipient mice were injected in the footpad with 2 × 10⁶ SNARF-labeled male (a) or female (b) DCs, and were adoptively transferred with 107 CFSE-labeled Marylin T cells. Popliteal lymph nodes were subjected to two-photon imaging at 24 h. The fate of individual T cell–DC contacts was followed over time (n = 20 for male DCs; n = 55 for female DCs). Plots show the percentage of interactions that had not terminated at the indicated time points. (c) Imaging subsequent interactions between activated T cells and DCs. On day 0, mice were injected in the footpad with unlabeled male DCs and at 24 h with SNARF-labeled male DCs. Two-photon imaging was performed at 48 h. The fate of individual contacts between T cell blasts and labeled DCs was followed over time (n = 31). Plot shows the percentage of interactions that had not terminated at the indicated time points. (d) Time-frame images showing that upon reencounter with Ag-bearing DCs, activated T cells also can establish prolonged contact. One example that is representative of 15/31 contacts between a T cell blast and a labeled DC is shown. Bar, 10 μm.
Figure 6.
Figure 6.
Successive encounters with Ag-bearing DCs in vivo promote CD25 expression on T cells and IFN-γ production. (a) Experimental design. At day 0, recipient mice were adoptively transferred with CFSE- labeled Marylin T cells. Injections of 106 DCs were performed at days 0 and 1. The first wave of DCs contained a limited amount of Ag-bearing DCs (105) to reduce the opportunity for T cells to interact with multiple DCs. The second wave of DCs (106 male or female DCs) was used to modulate the probability for a recently activated T cell to reengage another Ag-bearing DC. Cells from draining lymph nodes from the indicated recipient were analyzed by flow cytometry 38h after the second DC injection. (b) Re- encounter with Ag-bearing DCs had little effect on T cell proliferation. Data are gated on CD4+CD45.1+ cells. (c) Additional encounters with Ag-bearing DCs promote CD25 expression. Data are gated on CD4+CD45.1+ cells. (d) The percentage of CD25-positive Marylin T cells is graphed as a function of the number of cell divisions undergone. Results are means ± SD (n = 4). Results are representative of four independent experiments. (e) Additional encounters with Ag-bearing DCs promote IFN-γ production. Lymph node cells were restimulated in vitro for 4 h in the presence of Dby peptide, and subjected to intracellular staining. (f) The percentage of IFN-γ–producing Marylin T cells is graphed as a function of the number of cell division undergone. Results are means ± SD (n = 4). One representative experiment out of three is shown.

References

    1. Bousso, P., and E. Robey. 2003. Dynamics of CD8+ T cell priming by dendritic cells in intact lymph nodes. Nat. Immunol. 4:579–585. - PubMed
    1. Miller, M.J., A.S. Hejazi, S.H. Wei, M.D. Cahalan, and I. Parker. 2004. T cell repertoire scanning is promoted by dynamic dendritic cell behavior and random T cell motility in the lymph node. Proc. Natl. Acad. Sci. USA. 101:998–1003. - PMC - PubMed
    1. Stoll, S., J. Delon, T.M. Brotz, and R.N. Germain. 2002. Dynamic imaging of T cell–dendritic cell interactions in lymph nodes. Science. 296:1873–1876. - PubMed
    1. Mempel, T.R., S.E. Henrickson, and U.H. Von Andrian. 2004. T-cell priming by dendritic cells in lymph nodes occurs in three distinct phases. Nature. 427:154–159. - PubMed
    1. Miller, M.J., O. Safrina, I. Parker, and M.D. Cahalan. 2004. Imaging the single cell dynamics of CD4+ T cell activation by dendritic cells in lymph nodes. J. Exp. Med. 200:847–856. - PMC - PubMed

Publication types