. 2005 Nov;115(11):3035-44.
doi: 10.1172/JCI25681.

GM-CSF action in the CNS decreases food intake and body weight

Affiliations

GM-CSF action in the CNS decreases food intake and body weight

Jacquelyn A Reed et al. J Clin Invest. 2005 Nov.

Abstract

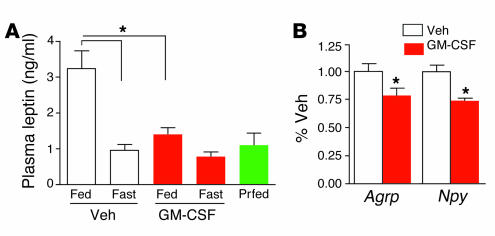
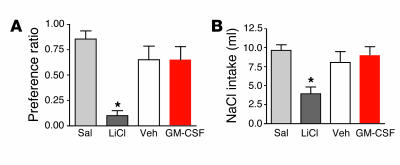
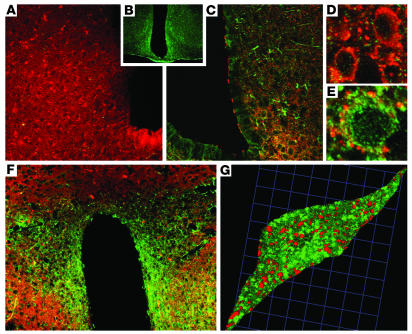
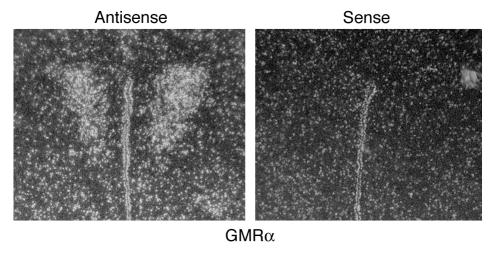
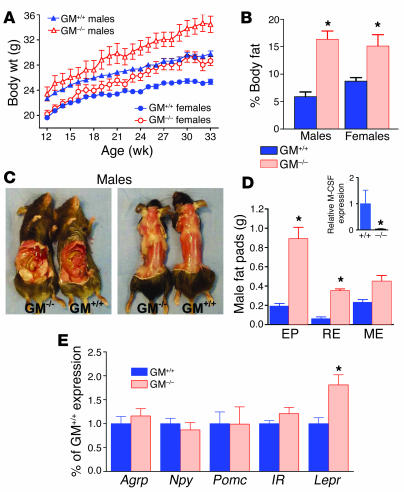
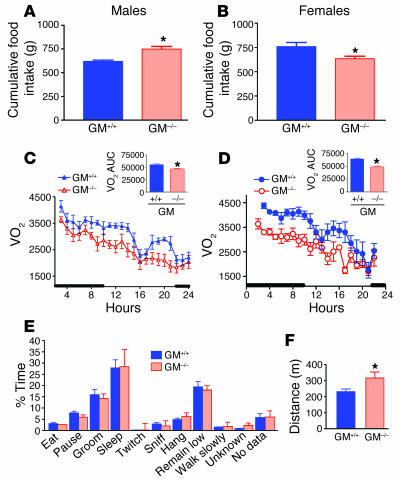
Many proinflammatory cytokines, such as leptin, play key roles in dynamic regulation of energy expenditure and food intake. The present work tested a role for the proinflammatory cytokine GM-CSF. Central but not peripheral administration of GM-CSF to adult rats significantly decreased food intake and body weight for at least 48 hours. Similar results were observed following central administration of GM-CSF in mice. GM-CSF receptor immunoreactivity was found on neurons within the paraventricular and arcuate nuclei of the hypothalamus. GM-CSF-deficient (GM-/-) mice weighed more and had significantly higher total body fat than wild-type (GM+/+) mice. Energy expenditure in GM-/- mice was decreased compared with that in GM+/+ mice. Taken together, these findings demonstrate that GM-CSF signaling in the CNS can regulate energy homeostasis.


Figures

Figure 1
Figure 1
i3vt injection of rat GM-CSF in rats. (A) Rats received a single injection of 0.03, 0.06, or 0.6 μg recombinant rat GM-CSF, or vehicle (Veh) alone. Twenty-four-hour food intake was significantly decreased in rats receiving 0.6 μg GM-CSF. (B) Change in body weight at 24 hours after injection was significantly greater in rats receiving 0.6 μg GM-CSF. (C) Rats were injected with 0.6 μg GM-CSF or vehicle. GM-CSF treatment significantly suppressed food intake at 4 hours, compared with vehicle treatment. (D) Rats were injected with 0.6 μg rat GM-CSF or recombinant human GM-CSF (hGM). While 24-hour food intake was suppressed with rat GM-CSF, human GM-CSF–treated rats did not differ from vehicle-treated rats. (E) Rats were injected with 0.6 μg GM-CSF or vehicle, followed by a 24-hour fast (day 1). Weight loss at 24 hours after injection was greater in rats injected with GM-CSF compared with vehicle. (F) When food was returned, anorexia persisted for an additional 24 hours (day 2). For all rat studies, n = 7–9; error bars show mean ± SEM. Twenty-four-hour food intake (G) and body weight (H) were decreased in mice receiving 1 μg mouse GM-CSF, compared with those receiving vehicle. n = 5–6; mean ± SEM. *P < 0.05.
Figure 2
Figure 2
Plasma leptin and hypothalamic AgRP and NPY expression were decreased following GM-CSF treatment. (A) Rats were given i3vt injections of vehicle or GM-CSF and then fed, fasted (Fast), or pair-fed (Prfed) for 24 hours. In fed rats, GM-CSF treatment decreased leptin levels compared with vehicle treatment. Fasted groups did not differ despite treatment and were similar to a pair-fed group. *P < 0.05; n = 7–9; mean ± SEM. (B) AgRP and NPY expression in hypothalamus was decreased in fasted rats killed after receiving 2 daily injections of GM-CSF. *P < 0.05; n = 5–7; mean ± SEM.
Figure 3
Figure 3
Tests for visceral illness following injection of GM-CSF. (A) Injection of isotonic saline (Sal) or lithium chloride (LiCl) or an i3vt injection of 0.6 μg GM-CSF or vehicle was paired with introduction of a novel grape- or cherry-flavored 0.15% saccharin solution. On a subsequent test day, intake of the flavor paired with LiCl was reduced, indicating development of a CTA. The preference for the flavor paired with GM-CSF injection did not differ from that of vehicle or saline, demonstrating that GM-CSF did not support a CTA. *P < 0.05; n = 7–9; mean ± SEM. (B) Sodium-depleted rats were given an i.p. injection of isotonic saline or LiCl or an i3vt injection of 0.6 μg GM-CSF or vehicle. Cumulative sodium solution (NaCl) intake was measured at 2 hours. In contrast to LiCl-injected rats, cumulative intake of NaCl was not suppressed in rats receiving GM-CSF treatment as compared with control rats receiving saline or vehicle. *P < 0.05; n = 7–9; mean ± SEM.
Figure 4
Figure 4
Peripheral administration of GM-CSF to rats. Rats received i.p. injection of vehicle or 6 μg GM-CSF or i3vt injection of vehicle or 0.6 μg GM-CSF. (A) Twenty-four-hour food intake did not differ among animals receiving i.p. vehicle, i.p. 6 μg GM-CSF, or i3vt vehicle. Food intake was decreased in rats receiving i3vt 0.6 μg GM-CSF. (B) Similarly, body weight was decreased in rats treated with 0.6 μg i3vt GM-CSF but not those treated with i3vt vehicle or injected i.p. with either GM-CSF or vehicle. (C) Subcutaneous injection of 30 μg/kg GM-CSF resulted in increased serum GM-CSF levels at 1, 2, and 4 hours after injection. GM-CSF levels were below the limit of detection at time point 0 in GM-CSF–injected rats (squares) and at all time points in vehicle-treated rats (triangles). At 24 hours after s.c. injection, body weight change in rats receiving 30 mg/kg GM-CSF did not differ from that in rats receiving vehicle (C, inset), and food intake did not differ for at least 3 days (D). *P < 0.05; n = 7 to 9; mean ± SEM.
Figure 5
Figure 5
GM-CSF receptor immunohistochemistry. Synaptophysin (red) and GMRα immunofluorescence (green) were localized on neurons throughout mouse brain, including ARC and PVN. (A) Only synaptophysin immunofluorescence was observed in sections when antibody serum was preincubated with the immunizing peptide to block GMRα antibody binding. (B) A section stained with GMRα immunofluorescence alone. (C) GMRα immunofluorescence was colocalized with synaptophysin immunofluorescence in the ARC (low-magnification view). (D) High-magnification view of several synaptophysin-immunoreactive neurons that did not contain GMRα. (E) High-magnification view of GMRα-positive cells surrounded by synaptophysin immunofluorescence contacts in the ARC. (F) GMRα immunofluorescence was colocalized with synaptophysin immunofluorescence in the PVN (low-magnification view). (G) High-magnification 3-dimensional reconstruction of confocal images of a single neuron from the PVN, showing colocalization of GMRα and synaptophysin immunofluorescence. Sections are representative of 5 animals in which staining was examined.
Figure 6
Figure 6
GM-CSF receptor in situ hybridization. Antisense probe for GMRα mRNA was hybridized to mouse brain sections. Signal was observed in the region of the PVN in sections. Signal from hybridization with control sense probes was not above background levels. Sections are representative of 4 animals in which hybridization was examined.
Figure 7
Figure 7
Body fat is increased in GM–/– mice. GM–/– and control GM+/+ male and female mice were monitored from 12 to 33 weeks of age. GM–/– mice gained significantly more body weight than did age- and sex-matched GM+/+ mice (A), and GM–/– mice had increased body fat as a percentage of total body weight (B). n = 7–11; mean ± SEM. (C) Visceral and s.c. fat were visibly increased in male GM–/– mice, compared with GM+/+ control mice. (D) Weights of epididymal (EP), retroperitoneal (RE), and mesenteric (ME) fat were increased in male GM–/– mice compared with GM+/+ control mice. *P < 0.05; n = 5; mean ± SEM. Inset: M-CSF expression was decreased in GM–/– mice. M-CSF mRNA was measured by Q-PCR in mesenteric fat from GM–/– and GM+/+ male mice. M-CSF expression was reduced in GM–/– mice, compared with GM+/+ mice. (E) NPY, AgRP, POMC, and insulin receptor (IR) mRNA expression were similar in both groups, but LepR expression was increased in GM–/– hypothalamus. n = 10–11; mean ± SEM. *P < 0.05.
Figure 8
Figure 8
Food intake, energy expenditure, and activity. Average daily food intake was slightly increased in GM–/– male mice (A) but was slightly lower in female GM–/– mice (B), compared with GM+/+ mice. VO2, measured by indirect calorimetry, was decreased in male (C) and female (D) GM–/– mice compared with GM+/+ mice. Area under the curve (AUC) was significantly decreased for both male (C, inset) and female (D, inset) GM–/– mice. Activity of male GM–/– and GM+/+ mice was monitored for a 24-hour period using video equipment. (F) Time spent performing various activities did not differ between male GM–/– and GM+/+ mice; however, the total distance traveled over the 24-hour period was greater for GM–/– mice than for GM+/+ controls. *P < 0.05; n = 7–11; mean ± SEM.

References

    1. Friedman JM. The function of leptin in nutrition, weight, and physiology. Nutr. Rev. 2002;60:S1–S14; discussion S68–S84, 85–17. - PubMed
    1. Gainsford T, et al. Leptin can induce proliferation, differentiation, and functional activation of hemopoietic cells. Proc. Natl. Acad. Sci. U. S. A. 1996;93:14564–14568. - PMC - PubMed
    1. Glaspy JA. Hematopoietic management in oncology practice. Part 1. Myeloid growth factors. Oncology (Williston Park). 2003;17:1593–1603. - PubMed
    1. Hamilton JA. GM-CSF in inflammation and autoimmunity. Trends Immunol. 2002;23:403–408. - PubMed
    1. La Cava A, Alviggi C, Matarese G. Unraveling the multiple roles of leptin in inflammation and autoimmunity. J. Mol. Med. 2004;82:4–11. - PubMed

Publication types

MeSH terms

Substances