. 2005 Nov;115(11):3045-56.
doi: 10.1172/JCI25330.

Cardiac-specific overexpression of AT1 receptor mutant lacking G alpha q/G alpha i coupling causes hypertrophy and bradycardia in transgenic mice

Affiliations

Cardiac-specific overexpression of AT1 receptor mutant lacking G alpha q/G alpha i coupling causes hypertrophy and bradycardia in transgenic mice

Peiyong Zhai et al. J Clin Invest. 2005 Nov.

Abstract

Ang II type 1 (AT1) receptors activate both conventional heterotrimeric G protein-dependent and unconventional G protein-independent mechanisms. We investigated how these different mechanisms activated by AT1 receptors affect growth and death of cardiac myocytes in vivo. Transgenic mice with cardiac-specific overexpression of WT AT1 receptor (AT1-WT; Tg-WT mice) or an AT1 receptor second intracellular loop mutant (AT1-i2m; Tg-i2m mice) selectively activating G(alpha)q/G(alpha)i-independent mechanisms were studied. Tg-i2m mice developed more severe cardiac hypertrophy and bradycardia coupled with lower cardiac function than Tg-WT mice. In contrast, Tg-WT mice exhibited more severe fibrosis and apoptosis than Tg-i2m mice. Chronic Ang II infusion induced greater cardiac hypertrophy in Tg-i2m compared with Tg-WT mice whereas acute Ang II administration caused an increase in heart rate in Tg-WT but not in Tg-i2m mice. Membrane translocation of PKCepsilon, cytoplasmic translocation of G(alpha)q, and nuclear localization of phospho-ERKs were observed only in Tg-WT mice while activation of Src and cytoplasmic accumulation of phospho-ERKs were greater in Tg-i2m mice, consistent with the notion that G(alpha)q/G(alpha)i-independent mechanisms are activated in Tg-i2m mice. Cultured myocytes expressing AT1-i2m exhibited a left and upward shift of the Ang II dose-response curve of hypertrophy compared with those expressing AT1-WT. Thus, the AT1 receptor mediates downstream signaling mechanisms through G(alpha)q/G(alpha)i-dependent and -independent mechanisms, which induce hypertrophy with a distinct phenotype.


Figures
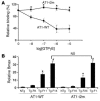
Figure 1
Figure 1
AT1 receptor binding assays. (A) Effects of GTPγS on 125I-Ang II binding to the membrane fraction of cardiac myocytes overexpressing AT1-i2m or AT1-WT. *P < 0.01 compared with AT1-WT. (B) Radioligand binding assays. Tg-WT (line 15, n = 5) and Tg-i2m mice (line 1, n = 7) had similar levels of AT1 receptor expression. The maximum binding (Bmax; fmol/mg protein) for NTg, Tg-WT (line 15), and Tg-i2m mice (line 1) was 9.0 ± 0.7, 283.3 ± 9.2, and 287.5 ± 13.7, respectively.The dissociation constant (Kd) (nM) for NTg, Tg-WT (line 15), and Tg-i2m mice (line 1) was 0.77 ± 0.13, 0.77 ± 0.19, and 0.79 ± 0.16, respectively. There was no significant difference in AT1 receptor expression between Tg-WT (line 15) and Tg-i2m mice (line 1). Tg-F8, Tg mice derived from the founder number 8 (line 8). *P < 0.01, #P < 0.001 compared with NTg mice. Experiments were conducted 4 and 3 times for A and B, respectively.
Figure 2
Figure 2
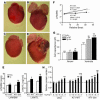
Cardiac hypertrophy in Tg-WT (line 15) and Tg-i2m mice (line 1). (AD) Hearts from age-matched nontransgenic littermates for Tg-WT (NTg-WT) (A), Tg-WT (B), NTg-i2m (C), and Tg-i2m mice (D) are shown. (E) Indices of LV hypertrophy, LVW/BW and LVW/TL, are shown (NTg-WT, n = 10; Tg-WT, n = 11; NTg-i2m, n = 15; Tg-i2m, n = 16). *P < 0.01, #P < 0.0001 compared with NTg mice. P < 0.01 compared with Tg-WT mice. (F) The relationship between AT1 receptor expression and LVW/BW reveals a dose-dependent increase in cardiac hypertrophy in both Tg-WT and Tg-i2m mice (Tg-WT, line 8, n = 6, line 11, n = 4, line 15, n = 5; Tg-i2m, line 16, n = 6, line 23, n = 4, line 1, n = 7). The slope of the relationship in Tg-i2m is 3 times that of Tg-WT mice. (G) Average cell capacitance measured in atrial and ventricular myocytes isolated from NTg, Tg-WT, and Tg-i2m mice. Numbers correspond to total number of cells measured. **P < 0.05 vs. NTg; §P < 0.05 vs. Tg-WT. Data points are from 8 NTg, 7 Tg-WT, and 9 Tg-i2m mice. (H) Protein content of neonatal rat cardiac myocytes transduced with adenovirus harboring LacZ, AT1-WT, or AT1-i2m, with or without various concentrations of Ang II stimulation. The protein content obtained from LacZ transduced myocytes without Ang II stimulation was designated as 1. **P < 0.05 vs. LacZ without Ang II. §P < 0.05 vs. LacZ 10–7 M Ang II. ##P < 0.05 vs. AT1-WT 10–7 M Ang II. Experiments were conducted in triplicate 3 times.
Figure 3
Figure 3
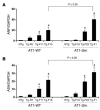
Fetal-type gene expression. Expression of ANF (A) and ASA (B) in LVs from Tg-WT (line 8, n = 6, line 11, n = 4, line 15, n = 5) and Tg-i2m mice (line 16, n = 6, line 23, n = 4, line 1, n = 7). There was a dose-dependent increase in the expression of ANF and ASA in both Tg-WT and Tg-i2m mice with significantly more ANF and ASA being expressed in Tg-i2m mice. *P < 0.01, #P < 0.001 compared with NTg mice.
Figure 4
Figure 4
Bradycardia, AV block, and LV function. (A) Representative lead II ECG of NTg (n = 10), Tg-WT (line 15, n = 10), and Tg-i2m mice (line 1, n = 10). Arrows point to P wave. Marked bradycardia and complete AV block are typically seen in Tg-i2m mice while moderate bradycardia and second-degree AV block are seen in Tg-WT mice. (B and C) The relationship between HR and AT1 receptor expression level in Tg-WT in B (line 8, n = 6, line 11, n = 4, line 15, n = 5) and Tg-i2m mice in C (line 16, n = 6, line 23, n = 4, line 1, n = 7). There is a dose-dependent decrease in HR in Tg-i2m but not in Tg-WT mice. (D) LV dP/dt of Tg-i2m (line 1, n = 4) and littermate NTg mice (n = 4) when heart was paced at 500 bpm. *P < 0.05, #P < 0.01 vs. NTg mice.
Figure 5
Figure 5
Morphology of AV node, calcium currents, and contraction. (A) Images obtained from β-gal–stained hearts to show AVN. Arrows point to AVN. A significantly smaller AVN was seen in MinK+/– Tg-i2m mouse hearts compared with MinK+/– hearts. Scale bars: 10 μm. (B) The estimated volume of AVN. Since the thickness of the serial section was 6 μm, if AVN can be observed in n sections and the area of AVN in the section k is Sk μm2, the volume of AVN (μm3) is roughly estimated as 6 × (S1+S2+S3+ . . . +Sn). *P < 0.05 vs. MinK+/–. (C) ICa of atrial myocytes from NTg, Tg-WT, and Tg-i2m mice. ICa density, calculated as peak inward ICa amplitude normalized to cell capacitance (pA/pF), is shown. Tg-i2m mice exhibited significantly smaller ICa amplitude compared with NTg and Tg-WT mice. There is a significant decrease in ICa density in myocytes from Tg-i2m mice compared with myocytes from NTg or Tg-WT mice. Data points are mean ICa density ± SEM in atrial myocytes of Tg-i2m (n = 22), Tg-WT (n = 24), and NTg (n = 50) mice from 4 Tg-i2m (line 1), 6 Tg-WT (line 15), and 6 NTg mouse littermates, respectively. (D) Myocyte contraction recorded in Tg-WT and Tg-i2m mouse myocytes. Data are means ± SEM. Numbers correspond to total number of cells measured. *P < 0.05 vs. NTg mice. Data points are from 8 NTg, 7 Tg-WT, and 9 Tg-i2m mice. The difference between NTg and Tg-i2m mice was also significant (P < 0.05) when the statistical analysis was conducted based upon the number of mice (NTg, 7.5% ± 0.2%; Tg-WT, 7.0% ± 1.1%; Tg-i2m 5.7% ± 0.5%).
Figure 6
Figure 6
Myocardial fibrosis and apoptosis. (A) Picric acid Sirius red (PASR) staining of heart sections obtained from Tg-WT (line 15, n = 5) and Tg-i2m (line 1, n = 7) mice. Significantly more fibrosis is seen in both Tg-WT and Tg-i2m mice than in their NTg littermates (n = 4 and n = 6, respectively), but Tg-i2m mice had significantly less fibrosis than Tg-WT mice. Scale bars: 1 μm. (B) Morphometry of myocardial fibrosis. (C) Morphometry of TUNEL staining of myocardial sections from NTg (n = 4 and n = 6 for AT1-WT and AT1-i2m, respectively), Tg-WT (line 15, n = 5), and Tg-i2m mice (line 1, n = 7). Tg-i2m mice had significantly fewer TUNEL-positive myocytes than Tg-WT mice. *P < 0.01, #P < 0.05 compared with NTg mice; P < 0.05 compared with Tg-WT mice.
Figure 7
Figure 7
Changes in hypertrophy and HR in response to Ang II. (A) Hypertrophic response to 2 weeks Ang II infusion (200 ng/kg/min). *P < 0.01 vs. corresponding control. §P < 0.05 vs. control Ang II; #P < 0.05 vs. Tg-WT Ang II; **P < 0.05 vs. NTg control; P < 0.01 Tg-WT control. n = 5 for all groups. (B) HR response to acute intravenous injection of Ang II (100 ng/kg). §P < 0.05 Tg-WT vs. Tg-i2m, Tg-WT mice exhibited increases in the atrial (P wave) rate in response to Ang II while Tg-i2m mice showed complete AV block and ventricular rates that did not respond to Ang II. n = 6 for NTg-WT; n = 8 for Tg-WT; n = 9 for NTg-i2m; and n = 5 for Tg-i2m mice.
Figure 8
Figure 8
Cell-signaling mechanisms in Tg-WT and TG-i2m mice. (A) Immunoblotting of phospho-ERK (p-ERK) and total ERK in the cytosolic fraction. *P < 0.01 vs. NTg; #P < 0.05 vs. AT1-WT. (B) Immunoblotting of p-ERK in the nuclear fraction. *P < 0.01 vs. NTg. (C) Immunoblotting of p-JNK and total JNK. #P < 0.05 vs. NTg; *P < 0.01 vs. Tg-WT. (D) Immunoblotting of p-p38 and total p38. *P < 0.01, #P < 0.05 vs. NTg; P < 0.001 vs. Tg-WT. (E) Immunoblotting of p-Src and total Src in the particulate fraction. #P < 0.05 vs. NTg. (F) Immunoblotting of phospho–PEA-15 and total PEA-15 in the cytosolic fraction. #P < 0.05 vs. NTg. Experiments were conducted 3 times each for AF. (G) Immunoblotting of PKCε in the particulate fraction (PF) and cytosolic fraction (CF) of Tg-WT and Tg-i2m mice. *P < 0.01 vs. NTg. (H) Immunoblotting of Gαq/11 in PF and CF. Significantly more Gαq/11 was translocated to the CF in Tg-WT than in Tg-i2m or NTg mice. #P < 0.05 vs. NTg. *P < 0.01 vs. Tg-WT. (I) Immunohistochemistry of p-ERK and PKCε. Arrows in upper panels indicate positive p-ERK–stained nuclei. Arrows in lower panels indicate membrane localization of PKCε. Scale bars: 1 μm. Bar graph shows quantitative analysis of nuclear p-ERK staining where the percentage ratio of p-ERK–positive nuclei is shown. Over 500 nuclei were counted per experiment. #P < 0.05 vs. NTg; *P < 0.01 vs. Tg-i2m. Experiments were conducted 3 times each for GI.

Comment in

Similar articles

Cited by

References

    1. Nicholls MG, Robertson JI, Inagami T. The renin-angiotensin system in the twenty-first century. Blood Press. 2001;10:327–343. - PubMed
    1. Baker KM, Booz GW, Dostal DE. Cardiac actions of angiotensin II: role of an intracardiac renin-angiotensin system. Annu. Rev. Physiol. 1992;54:227–241. - PubMed
    1. Pfeffer JM, Fischer TA, Pfeffer MA. Angiotensin-converting enzyme inhibition and ventricular remodeling after myocardial infarction. Annu. Rev. Physiol. 1995;57:805–826. - PubMed
    1. Sadoshima J, Izumo S. The cellular and molecular response of cardiac myocytes to mechanical stress. Annu. Rev. Physiol. 1997;59:551–571. - PubMed
    1. Dostal DE, Rothblum KN, Chernin MI, Cooper GR, Baker KM. Intracardiac detection of angiotensinogen and renin: a localized renin-angiotensin system in neonatal rat heart. Am. J. Physiol. 1992;263:C838–C850. - PubMed

Publication types

MeSH terms

Substances