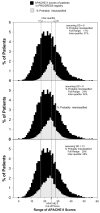
Application of a population-based severity scoring system to individual patients results in frequent misclassification
- PMID: 16277714
- PMCID: PMC1297617
- DOI: 10.1186/cc3790
Application of a population-based severity scoring system to individual patients results in frequent misclassification
Abstract
Introduction: APACHE II (AP2) was developed to allow a systematic examination of intensive care unit outcomes in a risk adjusted manner. AP2 has been widely adopted in clinical trials to assure broad consistency amongst different groups. Although errors in calculating the true AP2 score may not be reducible below 15%, the self-canceling effect of random errors reduces the importance of such errors when applied to large populations. It has been suggested that a threshold AP2 score be used in clinical decision making for individual patients. This study reports the AP2 scoring errors of researchers involved in a large sepsis trial and models the consequences of such an error rate for individual severe sepsis patients.
Methods: Fifty-six researchers with explicit training in data abstraction and completion of the AP2 score received scenarios consisting of composites of real patient histories. Descriptive statistics were calculated for each scenario. The standard deviations were calculated compared with an adjudicated score. Intraclass correlations for inter-observer reliability were performed using Shrout-Fleiss methodology. Theoretical distribution curves were calculated for a broad range of AP2 scores using standard deviations of 6, 9 and 12. For each curve, the misclassification rate was determined using an AP2 score cut-off of >or=25. The percentage of misclassifications for each true AP2 score was then applied to the corresponding AP2 score obtained from the PROGRESS severe sepsis registry.
Results: The error rate for the total AP2 score was 86% (individual variables were in the range 10% to 87%). Intraclass correlation for the inter-observer reliability was 0.51. Of the patients from the PROGRESS registry. 50% had AP2 scores in the range 17 to 28. Within this interquartile range, 70% to 85% of all misclassified patients would reside.
Conclusion: It is more likely that an individual patient will be scored incorrectly than correctly. The data obtained from the scenarios indicated that as the true AP2 score approached an arbitrary cut-off point of 25, the observed misclassification rate increased. Integrating our study of AP2 score errors with the published literature leads us to conclude that the AP2 is an inappropriate sole tool for resource allocation decisions for individual patients.
Figures


References
-
- Knaus WA, Draper EA, Wagner DP, Zimmerman JE. APACHE II: a severity of disease classification system. Crit Care Med. 1985;13:818–829. - PubMed
-
- Beale R, Reinhart K, Silva E, Dobb G, Sarwat S, Garg R, Vincent JL. Comparison of PROGRESS Severe Sepsis Registry patients to INDEPTH Integrated Severe Sepsis Clinical Trial Database placebo patients. Chest Meeting Abstracts; Chest. 2004;126:864S. Abstract #496.
Publication types
MeSH terms
LinkOut - more resources
Full Text Sources
Other Literature Sources
Medical
Research Materials

